
User Guide
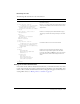
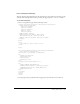
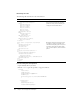
Table Of Contents
- Contents
- The CFML Programming Language
- Elements of CFML
- Using ColdFusion Variables
- Using Expressions and Number Signs
- Using Arrays and Structures
- Contents
- About arrays
- Basic array techniques
- Populating arrays with data
- Array functions
- About structures
- Creating and using structures
- Structure examples
- Structure functions
- Extending ColdFusion Pages with CFML Scripting
- Using Regular Expressions in Functions
- Building Blocks of ColdFusion Applications
- Creating ColdFusion Elements
- Writing and Calling User-Defined Functions
- Contents
- About user-defined functions
- Creating user-defined functions
- Calling user-defined functions
- Working with arguments and variables in functions
- Handling errors in UDFs
- A user-defined function example
- Using UDFs effectively
- Building and Using ColdFusion Components
- Contents
- About ColdFusion components
- Creating ColdFusion components
- Using ColdFusion components
- Passing parameters to methods
- CFC variables and scope
- Using CFCs effectively
- ColdFusion component example
- Creating and Using Custom CFML Tags
- Building Custom CFXAPI Tags
- Developing CFML Applications
- Designing and Optimizing a ColdFusion Application
- Contents
- About applications
- Elements of a ColdFusion application
- Structuring an application
- Defining the application and its event handlers in Application.cfc
- Migrating from Application.cfm to Application.cfc
- Using an Application.cfm page
- Optimizing ColdFusion applications
- Handling Errors
- Contents
- About error handling in ColdFusion
- Understanding errors
- Error messages and the standard error format
- Determining error-handling strategies
- Specifying custom error messages with the cferror tag
- Logging errors with the cflog tag
- Handling runtime exceptions with ColdFusion tags
- Using Persistent Data and Locking
- Contents
- About persistent scope variables
- Managing the client state
- Configuring and using client variables
- Configuring and using session variables
- Configuring and using application variables
- Using server variables
- Locking code with cflock
- Examples of cflock
- Securing Applications
- Contents
- ColdFusion security features
- About resource and sandbox security
- About user security
- Using ColdFusion security tags and functions
- Security scenarios
- Implementing user security
- Developing Globalized Applications
- Debugging and Troubleshooting Applications
- Contents
- Configuring debugging in the ColdFusion MX Administrator
- Using debugging information from browser pages
- Controlling debugging information in CFML
- Using the cftrace tag to trace execution
- Using the cftimer tag to time blocks of code
- Using the Code Compatibility Analyzer
- Troubleshooting common problems
- Designing and Optimizing a ColdFusion Application
- Accessing and Using Data
- Introduction to Databases and SQL
- Accessing and Retrieving Data
- Updating Your Database
- Using Query of Queries
- Contents
- About record sets
- About Query of Queries
- Query of Queries user guide
- Using dot notation
- Using joins
- Using unions
- Using conditional operators
- Managing data types for columns
- Using the CAST function
- Using aggregate functions
- Using group by and having expressions
- Using ORDER BY clauses
- Using aliases
- Handling null values
- Concatenating strings
- Escaping reserved keywords
- Using Queries of Queries with dates
- Understanding Query of Queries performance
- Understanding Query of Queries processing
- Managing LDAP Directories
- Building a Search Interface
- Contents
- About Verity
- Creating a search tool for ColdFusion applications
- Creating a search page
- Enhancing search results
- Working with data returned from a query
- Using Verity Search Expressions
- Requesting and Presenting Information
- Introduction to Retrieving and Formatting Data
- Building Dynamic Forms with cfform Tags
- Validating Data
- Contents
- About ColdFusion MX validation
- Validating form fields
- Handling invalid data
- Masking form input values
- Validating form data with regular expressions
- Validating form data using hidden fields
- Validating form input and handling errors with JavaScript
- Validating data with the IsValid function and the cfparam tag
- Creating Forms in Macromedia Flash
- Creating Skinnable XML Forms
- Creating Charts and Graphs
- Creating Reports for Printing
- Contents
- About printable output
- Creating PDF and FlashPaper output with the cfdocument tag
- Creating reports with the ColdFusion MX 7 reporting
- Reporting features
- Reporting architecture
- Getting started
- Basic steps for creating reports
- Report definition guidelines
- Common reporting tasks and techniques
- Grouping and group breaks
- Defining, modifying, and using fields and input parameters
- Using toolbox elements on report bands
- Aligning elements
- Using text styles
- Previewing reports
- Displaying page numbers
- Using layered controls
- Using links
- Using the Properties sheet
- Displaying reports
- Using input parameters to pass variables and other data at runtime
- Configuring RDS
- Using the Report Creation Wizard
- Using the Query Builder
- Using CFML in reports
- Using charts
- Using subreports
- Font management with printable reports
- Creating reports with Crystal Reports (Windows only)
- Using the Flash Remoting Service
- Using Server-Side ActionScript
- Contents
- About server-side ActionScript
- Connecting to the Flash Remoting service
- Using server-side ActionScript functions
- Global and request scope objects
- About the CF.query function and data sources
- Using the CF.query function
- Building a simple application
- About the CF.http function
- Using the CF.http function
- Using Web Elements and External Objects
- Using XML and WDDX
- Contents
- About XML and ColdFusion
- The XML document object
- ColdFusion XML tag and functions
- Using an XML object
- Creating and saving an XML document object
- Modifying a ColdFusion XML object
- Validating XML documents
- Transforming documents with XSLT
- Extracting data with XPath
- Example: using XML in a ColdFusion application
- Moving complex data across the web with WDDX
- Using WDDX
- Using Web Services
- Contents
- Web services
- Working with WSDL files
- Consuming web services
- About the examples in this section
- Passing parameters to a web service
- Handling return values from a web service
- Using cfinvoke to consume a web service
- Using CFScript to consume a web service
- Consuming web services that are not generated by Macromedia ColdFusion MX
- Calling web services from a Macromedia Flash client
- Catching errors when consuming web services
- Handling inout and out parameters
- Configuring web services in the ColdFusion MX Administrator
- Data conversions between ColdFusion and WSDL data types
- Consuming ColdFusion web services
- Publishing web services
- Using request and response headers
- Handling complex data types
- Troubleshooting SOAP requests and responses
- Integrating J2EE and Java Elements in CFML Applications
- Integrating COM and CORBA Objects in CFML Applications
- Contents
- About COM and CORBA
- Creating and using objects
- Getting started with COM and DCOM
- Creating and using COM objects
- Getting started with CORBA
- Creating and using CORBA objects
- CORBA example
- Using XML and WDDX
- Using External Resources
- Sending and Receiving E-Mail
- Interacting with Remote Servers
- Managing Files on the Server
- Using Event Gateways
- Contents
- About event gateways
- Event gateway facilities and tools
- Structure of an event gateway application
- Configuring an event gateway instance
- Developing an event gateway application
- Deploying event gateways and applications
- Using the CFML event gateway for asynchronous CFCs
- Using the example event gateways and gateway applications
- Using the Instant Messaging Event Gateways
- Using the SMS Event Gateway
- Creating Custom Event Gateways
- Index

Creating charts: examples 751
Creating charts: examples
This section contains examples of different types of charts.
Creating a bar chart
The example in the following procedure adds a title to the bar chart, specifies that the chart is
three dimensional, adds grid lines, sets the minimum and maximum y-axis values, and uses a
custom set of colors.
To enhance the bar chart:
1.
Open the chartdata.cfm file in your editor.
2.
Edit the cfchart tag so that it appears as follows:
<!--- Bar chart, from Query of Queries --->
<cfchart
scaleFrom=40000
scaleTo=100000
font="arial"
fontSize=16
gridLines=4
show3D="yes"
foregroundcolor="##000066"
databackgroundcolor="##FFFFCC"
chartwidth="450"
>
<cfchartseries
type="bar"
query="DeptSalaries"
valueColumn="AvgByDept"
itemColumn="Dept_Name"
seriescolor="##33CC99"
paintstyle="shade"
/>
</cfchart>
3.
Save the file as chartdatastyle1.cfm.
4.
View the chartdatastyle1.cfm page in your browser.
seriesLabel Elements: series:
type Type: Pie chart |
Type Frame chart: Elements: Shape: Bar | Line |
Pyramid | Area | Curve | Step | Scatter | Cone |
Cylinder | Horizontalbar |