
User Guide

cfchart 71
Usage
The cfchart tag defines a container in which a graph displays: its height, width, background
color, labels, and so on. The
cfchartseries tag defines the chart style in which data displays:
bar, line, pie, and so on. The
cfchartdata tag defines a data point.
Data is passed to the
cfchartseries tag in the following ways:
• As a query
• As data points, using the cfchartdata tag
For the
font attribute value ArialUnicodeMS, the following rules apply:
• In Windows, to permit Flash charts (type = "flash") to render a double-byte character set,
you must select this value.
• On UNIX, for all type values, to render a double-byte character set, you must select this value.
• If this value is selected, the fontBold and fontItalic attributes have no effect.
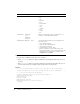
The following table lists W3C HTML 4 named color value or hexadecimal values that the
color
attribute accepts:
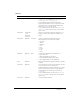
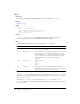
yAxisType Optional category Currently has no effect, as the y-axis is
always used for data values.
yOffset Optional 0.1 Number of units by which to display the chart
as angled, vertically. Applies if
show3D="yes".
The number can be between -1 and 1, where
"-1" specifies 90 degrees left and "1"
specifies 90 degrees right.
Color name RGB value
Aqua ##00FFFF
Black #000000
Blue ##0000FF
Fuchsia ##FF00FF
Gray ##808080
Green ##008000
Lime ##00FF00
Maroon ##800000
Navy ##000080
Olive ##808000
Purple ##800080
Red ##FF0000
Silver ##C0C0C0
Attribute Req/Opt Default Description