
User Guide


68 Chapter 2: ColdFusion Tags
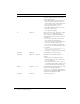
fontBold Optional no Whether to make the text bold:
• yes
• no
fontItalic Optional no Whether to make the text italicized:
• yes
• no
fontSize Optional 11 Font size; integer.
foregroundColor Optional black Color of text, grid lines, and labels.
Hexadecimal value or supported named
color; see name list in Usage.
For a hexadecimal value, use the form
"##xxxxxx" or "##xxxxxxxx", where x = 0-9 or
A-F; use two number signs or none.
format Optional flash File format in which to save the graph:
• flash
• jpg
• png
gridlines Optional 10, including
top and bottom
Number of grid lines to display on the value
axis, including axis; positive integer.
labelFormat Optional number Format for y-axis labels:
• number
• currency
• percent
• date
markerSize Optional (Automatic) Size of data point marker in pixels; integer.
name Optional Page variable name; string. Generates the
the graph as binary data and assigns it to the
specified variable. Suppresses chart display.
You can use the
name value in the cffile tag
to write the chart to a file.
pieSliceStyle Optional sliced Applies to the
cfchartseries type attribute
value
pie.
• solid: displays pie as if unsliced.
• sliced: displays pie as if sliced.
rotated Optional no Whether to rotate the chart 90 degrees:
• yes
• no
scaleFrom Optional Determined by
data
Y-axis minimum value; integer.
scaleTo Optional Determined by
data
Y-axis maximum value; integer.
Attribute Req/Opt Default Description