
User Guide

118 Chapter 9 Debugging Application Code
Overview of the Interactive Debugger
You can run the debugger against your application pages to find errors in your code,
when Remote Development Services (RDS) is enabled and a server mapping is
defined. Debugging is not supported on Windows 98.
The debugger lets you perform these tasks:
• Set breakpoints and watches
• Evaluate variables and expressions
• Step through lines of code
• Investigate the code stack
• Monitor recordsets
• Observe variables in all scopes
To run debugging processes, use the Debug menu or the Debug toolbar.
Setting up a Debugging Session
These are the tasks that you perform to set up a debugging session:
• Select or configure a RDS server against which to run a debugging session.
• Specify server, file, and browser mappings so that ColdFusionStudio can locate
the ColdFusion development server and the files to debug.
The following procedure describes these tasks. For more information, see “Working
with Files on Remote Servers” on page 13.
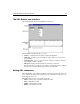
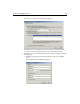
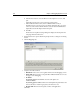
To set up a debugging session:
1 Open an application page.
2Select Debug > Debug Settings.