
User Guide
Chapter 9
Debugging Application Code
For debugging simple pages, using debugging information that is reported from the
application server is adequate, but complex development tasks require a more
powerful and immediate debugging interface.
The Interactive Debugger runs against dynamic pages on the ColdFusion Server. You
can set breakpoints and step through the code to isolate and correct problems.
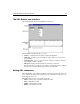
A tabbed debug window provides breakpoints, variables, recordsets, tag and page
hierarchies, and page output. From these panes, you can set watches; manage
breakpoints; and evaluate variables and expressions.
For more information, see the ColdFusion Administrator Debugging Options section
inAdvanced ColdFusion Server Administration.
For information on debugging ColdFusion applications, see Developing ColdFusion
Applications.
Contents
• Overview of the Interactive Debugger................................................................... 118
• Setting up a Debugging Session............................................................................. 118
• Using the Interactive Debugger ............................................................................. 121