
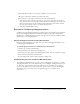
System information


56 Chapter 5: Lesson 2: Configuring Your Development Environment
The location of the debugging information or the type of debugging data shown varies,
depending on the options that you enable on the Debugging page in the ColdFusion MX
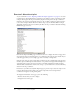
Administrator. In the following example, the debugging output includes general information
about the ColdFusion server, the execution time of the application, and variable information:
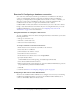
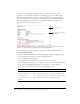
The following figure shows an example of how debugging information can appear when
appended to the bottom of a page in a browser:
If you are using a development server to build the sample application in this tutorial, you can
enable some of these settings to help debug any unexpected problems.
Use the following steps to enable debugging options in the ColdFusion MX Administrator.
To enable debugging options:
1.
In the ColdFusion MX Administrator, select Debugging & Logging > Debugging Settings.
A list of debugging options appears on the Debugging Settings page.
2.
Select the Enable Debugging check box.
The debugging service is enabled for all options already selected on the page.
3.
On the Debugging Settings page, view the description of each option that is enabled. If you do
not want to append debugging information for a specific option, clear the check box.
For the purpose of this tutorial, enable the following debugging options:
4.
Click Submit Changes when you are done.
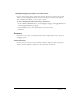
Option Description
Database Activity Identifies database activity related to SQL query events.
Exception Information Identifies ColdFusion exceptions raised in the debugging output.
Tracing Information Lets you trace event information reported in the debugging output.
Form, URL and Session
Variables
Displays variable information in the debugging output.
The appended debugging
information
The application form