
User Guide

72 Chapter 5 Graphing Data
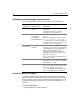
Example: adding a pie chart
The example in the following procedure adds a pie chart to the page.
To create a pie chart:
1 Open graphdata.cfm in ColdFusion Studio.
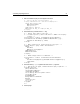
2 Edit the DeptSalaries query and the
cfloop code so that they appear as follows:
<!--- A query to get statistical data for each department. --->
<cfquery dbtype = "query" name = "DeptSalaries">
SELECT
Dept_Name,
SUM(Salary) AS SumByDept,
AVG(Salary) AS AvgByDept
FROM GetSalaries
GROUP BY Dept_Name
</cfquery>
<!--- Reformat the generated numbers to show only thousands --->
<cfloop index="i" from="1" to="#DeptSalaries.RecordCount#">
<cfset DeptSalaries.SumByDept[i]=Round(DeptSalaries.SumByDept[i]/
1000)*1000>
<cfset DeptSalaries.AvgByDept[i]=Round(DeptSalaries.AvgByDept[i]/
1000)*1000>
</cfloop>
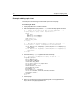
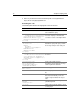
3 Add the following cfgraph tag before the end of the body:
<!--- Pie graph, from DeptSalaries Query of Queries --->
<cfgraph type="pie"
query="DeptSalaries"
valueColumn="SumByDept"
itemColumn="Dept_Name"
title="Total Salaries by Department"
titleFont="Times"
showValueLabel="rollover"
valueLabelFont="Times"
borderWidth = 0
backgroundColor = "##CCFFFF"
colorlist="##6666FF,##66FF66,##FF6666,##66CCCC"
LegendFont="Times">
</cfgraph>
<br>
4Save the page.
5 Return to your browser and enter the following URL to view graphdata.cfm:
http://127.0.0.1/myapps/graphdata.cfm