
User Guide

70 Chapter 5 Graphing Data
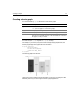
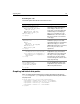
4 Return to your browser and enter the following URL to view graphdata.cfm:
http://127.0.0.1/myapps/graphdata.cfm
Reviewing the code
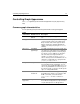
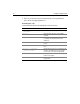
The following table describes the highlighted code and its function:
Code Description
title = "Average Salary by
Department"
Put a title above the graph.
depth = 10
Give the graph 10 pixels of 3D "depth"
shadow.
scaleTo = 100000
Set the maximum value of the vertical axis
to 100000. The minimum value is the
default, 0.
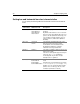
itemLabelSize=16
Make the labels on the horizontal axis 16
points.
itemLabelOrientation="horizontal"
Make the labels horizontal on the horizontal
axis.
colorList = "red,orange,
green,teal,purple"
Get the bar colors from a custom list. In this
example, the graph does not use purple
because there are only four data points.
gridLines = 4
Display four grid lines between the top and
bottom of the graph.
barSpacing = 15
Separate the bars by 15 pixels of
background.