
User Guide

Controlling Graph Appearance 69
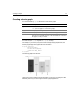
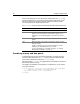
Example: adding character to a bar graph
The example in the following procedure adds a title to the bar graph and changes its
appearance from the default, flat look, to a 3D look. It adds gridlines, sets the
maximum Y-axis value to 100000, separates the bars, and uses a custom set of colors.
To enhance the bar graph:
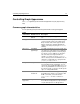
1 Open graphdata.cfm in ColdFusion Studio.
2 Edit the
cfgraph tag so that it appears as follows:
<!--- Bar graph, from Query of Queries --->
<cfgraph type="bar"
query="DeptSalaries"
valueColumn="AvgByDept"
itemColumn="Dept_Name"
title = "Average Salary by Department"
depth = 10
scaleTo = 100000
itemLabelSize=16
itemLabelOrientation="horizontal"
colorList = "red,orange,green,teal,purple"
gridLines = 4
barSpacing = 15>
</cfgraph>
3Save the page.
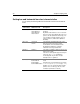
Data point
colors
colorList A comma-separated list of colors to use for
each bar.
You can use any of the 256 standard Web
colors and any valid Web color name
notation (for example, blue or ##FF33CC).
You must use double pound signs with
hexadecimal color notation. These colors
replace the standard system-defined colors.
If you specify fewer colors than data points,
the colors repeat. If you specify more colors
than data points, the extra colors are not
used.
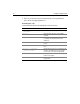
Bar spacing barSpacing The space, in pixels, between bars.
Any 3D shadow specified by the
depth
attribute appears in this space, so if you want
the background to appear between all bars,
make the
barSpacing value greater than the
depth value.
Graph
characteristic Attributes used Description