
User Guide

68 Chapter 5 Graphing Data
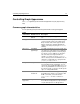
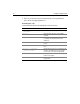
Setting bar and horizontal bar chart characteristics
You can specify the following additional characteristics for bar and horizontal bar
charts:
Graph
characteristic Attributes used Description
Value labels showValueLabel
valueLabelFont
valueLabelSize
valueLocation
Labels that display the numeric value being
graphed.
By default, value labels are on. You can turn
them off or have them display when the user
points to the bar (Flash file format only). You
can specify the font type (Arial, Courier, or
Times), point size, and location (OnBar or
OverBar).
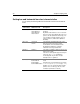
Value axis scaleFrom
scaleTo
The minimum and maximum points on the
data axis (vertical axis for bar charts,
horizontal axis for horizontal bar charts.
By default the minimum is 0 and the
maximum is the largest data value.
Grid lines gridLines The number of grid lines between the top and
bottom of the graph.
The value of each grid line appears along the
value axis. The
cfgraph tag displays
horizontal grids only. A value of 0 (the
default) means no grid lines.
Item labels showItemLabel
itemLabelFont
itemLabelSize
itemLabelOrientation
Labels to show on the second axis of the
chart.
Item labels are on by default if you specify an
itemColumn (or for cfgraphdata tags, item)
attribute. You can specify the label font type
(Arial, Courier, or Times), point size, and
orientation (horizontal or vertical).