
User Guide

66 Chapter 5 Graphing Data
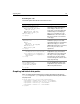
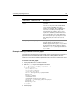
This pie chart displays the income values of four departments. Each cfgraph tag
specifies a department’s income and the corresponding item description for the
legend. The values are specified by individual ColdFusion variables. The title
“Income by Department” appears above the chart.
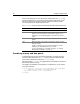
The
cfgraphdata tag lets you specify the following information about a data point:
Combining a query and data points
To graph data from both query and individual data value, you specify the query
name and related attributes in the
cfgraph tag and provide the additional data
points and their appearance attributes in
cfgraphdata tags.
Data specified by a
cfgraphdata tag is graphed before (for example, to the left on a
bar chart) the data from a query.
For example, if the database is missing data for one department, you can add the
information manually:
<cfgraph type="bar" title="Salaries by Department" query="DataTable"
itemColumn ="Dept_Name" valueColumn="AvgByDept"
<cfgraphdata item="Facilities" value="35000">
</cfgraph>
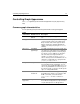
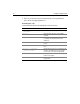
Attribute Description
value The data value to be graphed.
item (Optional) The description for this data point. The item normally
appears on the horizontal axis of bar and line graphs, on the
vertical axis of horizontal bar graphs, and in the legend in pie
charts.
color (Optional) The color of the bar or pie slice. Ignored for line and area
graphs.
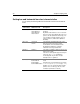
URL (Optional) Works only with bar, horizontal bar, and pie charts in
Flash file format.
A URL to load when the user clicks this data point. Use this
attribute to do data drill-down from your charts.
For more information on using URLs in graphs, see “Linking
Dynamically from Graphs,” on page 77.