
User Guide

Creating a Graph 61
Creating a basic graph
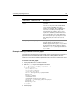
You use the following cfgraph attributes to create a basic graph:
You must end your
cfgraph tag with a </cfgraph> end tag.
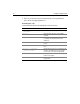
For example, if you have a query that contains average salary by department, the
following tag displays a bar graph with the information:
<cfgraph type="bar"
query="DataTable"
valueColumn="AvgByDept"
itemColumn="Dept_Name">
</cfgraph>
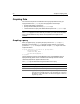
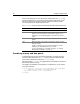
The resulting graph looks like this:
Later sections in this chapter provide information on how you can specify the data
differently and how you can change and enhance graph appearance.
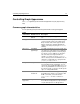
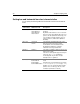
Attribute Description
type Must be one of the following values:
bar, horizontalbar, pie, or
line. (An area graph is a kind of line graph.)
query The query containing the data.
valueColumn The query column containing the values to be graphed.
itemColumn (Optional) The query column containing the description for this data
point. The item normally appears on the horizontal axis of bar and
line graphs, and in pie charts.