
Operator's manual Owner manual

16
Gas sampling and gas conditioning technology 9-3.15-ME
Every change of the oxygen concentration produces a lineary proportional change of the com-
pensation current and can be read directly in % O
2
as oxygen value on the display .
Due to its very small stagnant volume (2 cm
3
) and the direct flow of the M&C measuring cell, an
extremely fast response time (T
90
-time) of 1 second for a high gas flow can be realized.
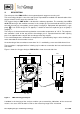
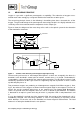
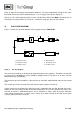
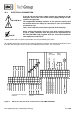
13 GAS FLOW DIAGRAM
Figure 3 shows the gas flow diagram of the Oxygen Analyser PMA 50 Ex.
1 : External fine filter
2 : External flow meter
3 : Ventilate arrestor
4 : Measuring cell
5 : Flow alarm sensor
6 : Ventilate arrestor
3
4
5
6
2
1
Figure 3 Gas flow diagram
The measuring cell 4 must absolutely be protected against dust particles. Therefore, the preced-
ing external gas conditioning system should be equipped with a fine filter 1 of at least 2 micron
filter porosity (eg. type FP-2T).
The maximum gas flow of 60Nl/h is adjusted via an externally mounted flow meter 2 with needle
valve.
The sample gas enters the measuring cell 4 via the inlet ventilate arrestors 3.
A flow sensor 5 in the outlet of the measuring cell is controlling the gas flow through the cell ac-
cording to the measuring principle of thermal conductivity. In case the minimum gas flow is de-
creased, an alarm is automatically given and is available as status alarm on the the collective
status output. Furthermore, an alarm state is shown by a colour change of the LED 4 (see figure
1) on the front plate of the analyzer.