Tutorial for MasterPlex® GT v2 © 2006 Hitachi Software Engineering America, Ltd. All Rights Reserved.
The MasterPlex GT software is designed for genotyping analysis of Single Nucleotide Polymorphisms (SNPs) and Human Leukocyte Antigen (HLA) typing with data generated from the Luminex system. In this tutorial, we will be going over five main steps in analyzing a Luminex data file with the MasterPlex GT v2 software: 1) Using the Typing Table 2) Setting up Allele Call Parameters 3) Utilizing the Allele Call Window 4) Analyzing the Data with the Graph Window 5) Printing Reports http://www.miraibio.
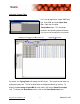
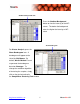
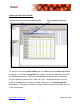
Using the Typing Table Let’s start by opening a sample SNP data file. Press File and select Open Data File. Open the file called “SampleBase.csv”. This should be located in the following default directory: C:\Program Files\HitachiSoft\MasterPlex GT\SampleData Displays the Percentage of total MFI for the Locus Displays the Bead Count By default, the Typing Table will display the MFI values. The sample or well data are displayed row by row. The loci or bead data are displayed column by column.
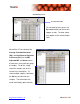
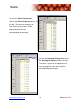
View data by Locus Loci shown as tabs To view data by locus, press the By Locus button and the loci will appear as tabs. The data shown only applies to the selected tab or locus. MasterPlex GT can calculate the Average, Standard Deviation (SD), and Coefficient of Variation in Percent (CV%) for the MFI, Adjusted MFI, and Count values of each locus for a particular group of samples. To do this, simply select the samples you wish to include in the calculation.
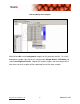
Gradient Background view Press the Gradient Background button to view the intensity of the MFI values. The darker the background color, the higher the intensity or MFI value. Show Dendrogram For Cluster Analysis, press the Show Dendrogram icon. A dendrogram will appear to the left of the Well Names. By default, Ward’s Method is used to generate the dendrogram based on Genotype.
Selecting Background Samples Wells A1 and D3 are the background samples for this particular data file. To set the background sample, right-click on the sample under Sample Name or Well Name and select Local Negative Control. Repeat this for both samples and the average MFI of each locus for these samples will be subtracted from all the other samples. http://www.miraibio.
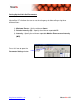
Setting Up the Allele Call Parameters MasterPlex GT v2 allows the user to set the stringency of allele calling using three different filters: 1) Minimum Events – Set the minimum Count. 2) Relative Intensity (RI) – Specify the minimum reportable RI. 3) Intensity – Specify the minimum reportable Median Fluorescence Intensity (MFI). Press this icon to open the Parameter Setting window. http://www.miraibio.
The Parameter Setting window allows the user to insert the Allele Call parameters: Minimum Events Relative Intensity (RI) Intensity or (MFI) The RI based Allele call uses two parameters: RI and Intensity Threshold. The Intensity based Allele call just uses the Intensity Threshold. For this tutorial, we will just use the default values of 20 Minimum Events, 25% Minimum Reportable RI, and 35 Minimum Reportable MFI.
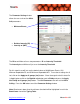
Utilizing the Allele Call Window Press the Bell icon to view the Allele Calling results Paint Background toggle button To view the results of the Allele Calling, press the Bell icon and the Allele Call window will pop up. Just like the Typing Table, the samples are displayed by rows and the loci are displayed by columns. The bases are highlighted by default if they are different than the reference sample, which is A1 in this case.
To view the Allelic Frequencies, click on the Allele Frequency tab on the top. The count or frequency of each allele for each locus will be displayed along with the corresponding percentages. To view the Genotype Frequencies, press the Genotype Frequency tab on the top. The count is given for the appearance of each genotype for each locus with the corresponding percentages. http://www.miraibio.
Close Window Haplotype Frequency tab To view the Haplotype Frequency, simply click on the Haplotype Frequency tab. All the Haplotypes with a frequency greater than or equal to 1 will be displayed along with the total counts and percentages. To close the Allele Call window, click on the X icon. http://www.miraibio.
Analyzing the Data with the Graph Window MasterPlex GT enables the user to view the data in the form of bar graphs (2D and 3D), heatmaps, and scatter plots. There are two ways of opening the Graph window: Clicking on the Show Graph icon Clicking on the Multi Graph link The Graph window will initially be empty when it appears. To view the individual bar graphs for each sample, click on the corresponding samples under the Sample Name table.
Toggle 2D and 3D Button Toggle MFI and RI values Show Dendrogram By default, the graphs are all MFI based. To view graphs for the RI values, simple click on the RI icon from the top icon menu. To switch back to the MFI based calculations, click on the MFI icon. To toggle between 2D and 3D views of the charts, press the Toggle 2D and 3D button on the top icon menu. The Show Dendrogram button is also available in the Graph window (Refer to Page 5 for more details on the Dendrogram feature). http://www.
Heatmap Depth Bar Graph Tab The Heatmap is automatically displayed in the Graph window. It shows the intensity of the MFI Percentage for each allele based on the Heatmap Color Indicator which goes from black to red with red indicating the highest percentages. To view the locus names, just hover over the each color panel with the mouse and a label will appear with the locus name, MFI value, and Percentage of total MFI for each allele.
MasterPlex GT offers two ways of analyzing and comparing a pair of samples or alleles in the Graph window: 1) Sample by Sample – View the scatter plot of 2 selected samples 2) Allele by Allele – View the scatter plot of 2 selected alleles Two-Sample Comparison Mode Sample by Sample Tab Correlation Coefficient To begin comparison of two samples, press the Two-Sample Comparison Mode icon and then click on the Sample by Sample tab.
Allele by Allele Tab To perform analysis of two alleles, press the Allele by Allele Tab. Next, select 92R7 C and DYS391 C from the Allele Name table. This will bring up the scatter plot for the two alleles. The labels for each data point will appear if you click on the graph. The color codes are exactly the same as for Sample by Sample analysis: White points – Alleles that are not called in either sample. Red points – Alleles called in the Y-axis sample only.
MasterPlex GT is capable of displaying the pairwise comparisons for all loci based on correlation coefficients with the Homology Chart icon. Show Homology Chart The Homology Table gives the pairwise comparison of all loci based on the correlation coefficients. The background color indicates the degree of similarity with blue signifying 100% identity. http://www.miraibio.
Homology Chart Tab To view a 3D graphical representation of the Homology Table, press the Homology Chart tab. The y-axis represents the correlation coefficient from zero to one. The xaxis and z-axis represent each locus in the order they are presented in the Homology Table under Well Name or Sample Name. http://www.miraibio.
Printing Reports MasterPlex GT allows the user to print the following reports: Sample Information including Instrument Status, Background Information, and Allele Call Parameter Settings Allele Call Table – Allele, Genotype, and Haplotype Frequency Tables All Charts created by the user Cluster Analysis and Heatmap Raw Data Report Manager Icon To launch the Report Manager, click on the Report Manager icon, which looks like a camera.
Open Save Print Close The Preview window enables the user to Open, Save, and Print reports. To close the Preview window, click on the X icon. Notes: To add a particular chart to the report, right-click on the chart and select Add to Report. To save your analysis data in MasterPlex GT, click on File and select Save Project. The project file may be opened later for further analysis by clicking on File and selecting Open Project File. http://www.miraibio.
Congratulations! You have just finished analyzing the SNP data file utilizing MasterPlex GT v2. As you can see, the MasterPlex GT Genotyping Software has been specifically designed to simplify genotyping and haplotyping analyses from multiplexed data generated with the xMAP platforms. Integrating a wide variety of graphical data presentations as well as advanced statistics, MasterPlex GT provides rapid screening and analysis for all genomic laboratories. http://www.miraibio.
You can contact MiraiBio with any questions you have at (510) 337-2000 (USA phone number) or by sending an email to support@miraibio.com. MiraiBio A division of Hitachi Software 1201 Harbor Bay Parkway Suite 150 Alameda, CA 94502 Telephone 1.800.624.6176 1.510.337.2000 Facsimile 1.510.337.2099 Trademark Acknowledgments MasterPlex is a trademark of Hitachi Software Engineering Co., Ltd. Luminex® is a registered trademark of the Luminex Corporation.