
Software


xMAP Technology Troubleshooting
PN 89-00002-00-150 Rev. A 8 - 11
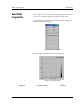
Bead Detail
Irregularities
You can diagnose many problems by using the histogram described
on page 6-17 or the Bead details box described on page 6-20.
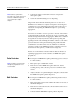
A normal bead detail display is shown below. It depicts a tight bead
population within a white region.
Figure 8-1. Normal Bead Detail
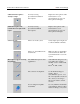
The histogram for the bead detail above looks like this:
Figure 8-2. Normal Histogram
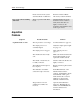
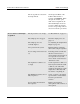
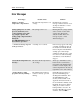
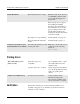
Symptom Possible Problem Solution