
Manual

xMAP Technology Using Luminex 100 IS 2.2 Software
PN 89-00002-00-069 Rev. A 6 - 103
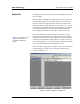
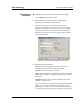
Grid Lines: The Graph can contain vertical grid lines,
horizontal grid lines, both vertical and horizontal grid lines, or
no grid lines. Select the appropriate radio button.
Grid in front of data: Check this option to place the grid in
front of the data graphics. Otherwise, the data graphics are
drawn on top of the grid.
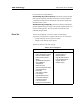
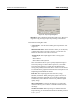
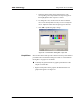
• Axis Tab—Use the Axis tab to change your X axis and Y axis
values and specify whether to display them as linear or log.
See Figure 93.
Figure 93. Customization Dialog Box—Axis Tab
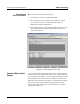
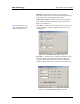
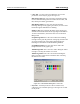
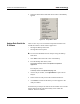
• Font Tab—Use the Font tab to change the appearance of the
fonts that appear in the Main Title, Sub Title, and Subset/
Point/Axis Label fields. The bottom the of the dialog box
displays a sample of the font as you select it. See Figure 94.
Figure 94. Customization Dialog Box—Font Tab
Note: If you select Log, use
“Auto” or ensure that the “Min”
value is greater that zero.