
User guide

Chapter 4
_________________________________________________________________________
________________________________________________________________________
BE6027-12 LumaSoft Gas Software LumaSense Technologies A/S
7810 and 7860 Page 96 of 194
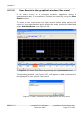
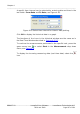
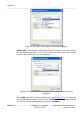
A specific time interval can be selected by entering date and time in the
two fields: From Date and To Date, see Figure 4.65.
Figure 4.65 Select time interval for historic data plotting.
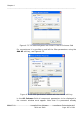
Click OK to display the historical data in a graph.
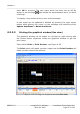
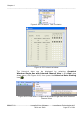
The functions of the icons in the historical window are the same as in
the Real Time Window described in Section 4.2.2.7.
To continue the measurements performed in the specific task, press the
green arrow icon or select Start in the Measurement drop down
menu, see Figure 4.3.
To display the incoming measuring data (real time data) select the
icon.