
User guide


Chapter 4
_________________________________________________________________________
________________________________________________________________________
BE6027-12 LumaSoft Gas Software LumaSense Technologies A/S
7810 and 7860 Page 86 of 194
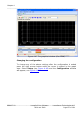
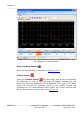
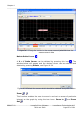
Figure 4.50 Select two measurement points on the same curve to get
the difference in concentration
Historical Data Plotting
Historical data plotting is described in Section 4.2.2.9.
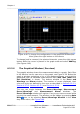
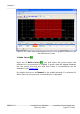
X Delta Cursor
Press the X Delta Cursor icon and select two points to determine
the difference in time. A light red area will appear between the two
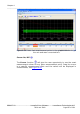
points and the time difference will be displayed, see Figure 4.52. When
using this function the statistics shown in the middle window are
calculated for the measurement points within the chosen interval and
will be marked with red text color, see Figure 4.51.