
User guide


Chapter 4
_________________________________________________________________________
________________________________________________________________________
BE6027-12 LumaSoft Gas Software LumaSense Technologies A/S
7810 and 7860 Page 85 of 194
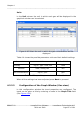
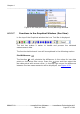
Figure 4.49 View pull-down: Errors/Warnings Window
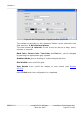
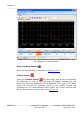
4.2.2.7 Functions in the Graphical Window (Gas View)
In the top of the Graphical window the Icon Tool Bar is displayed.
The tool bar makes it easier to handle and process the obtained
measurement data.
The function behind each icon will be explained in the following section.
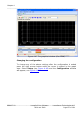
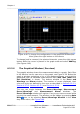
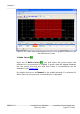
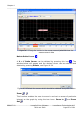
Find Difference
The function
∆
h, will calculate the difference in the value for two data
points on the same filter curve. Press the icon and then select the
two data points with mouse clicks. In the top right corner the difference
between the two measurements will be displayed, see Figure 4.50.