
User guide


Chapter 4
_________________________________________________________________________
________________________________________________________________________
BE6027-12 LumaSoft Gas Software LumaSense Technologies A/S
7810 and 7860 Page 80 of 194
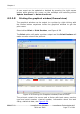
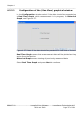
4.2.2.4 Configuration of filters (Gas view)
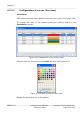
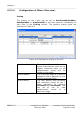
Scaling
The scaling on the Y-axis can be set to AutoScaleMinAndMax,
AutoScaleMax or AutoScaleOff in the field selection individually for
each filter in the Scaling column. The possible scaling types are
described in Table 4.3.
Figure 4.44 Setting the scaling of the axis
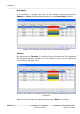
AutoScaleMinAndMax
The scale will cover from the
lowest measurement value to the
highest measured value, i.e. all
measurement points will be
visible on the graph.
AutoScaleMax
The Y-axis will begin at 0 and the
maximum value depends on the
highest measured value.
AutoScaleOff
The user defines both minimum
and maximum values for
the Y
scale manually, by defining
YScalemin and YScaleMax
. This
can be of use to view
measurement points in a
particular range.
Table 4.3 Shows the possible Scaling types of the Y-axis