
User guide


Chapter 4
_________________________________________________________________________
________________________________________________________________________
BE6027-12 LumaSoft Gas Software LumaSense Technologies A/S
7810 and 7860 Page 74 of 194
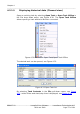
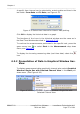
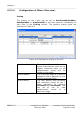
Figure 4.32 File menu: Task Contents.
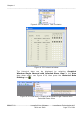
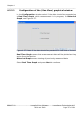
Figure 4.33 Contents window
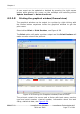
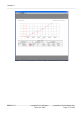
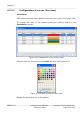
The historical data can be displayed by selecting Graphical
Window>Single Channel with Selected Gases View in the View
drop down menu, see Figure 4.34, then press the Historical Data
Plotting icon .
Figure 4.34 View menu: Graphical Window>Single Channel with
Selected Gases View