
User guide


Chapter 4
_________________________________________________________________________
________________________________________________________________________
BE6027-12 LumaSoft Gas Software LumaSense Technologies A/S
7810 and 7860 Page 65 of 194
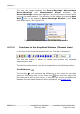
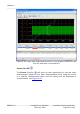
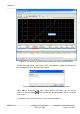
Figure 4.21 Select two measurement points in the graphic window to get
the difference in time
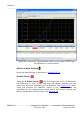
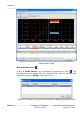
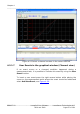
Y Delta Cursor
Press the Y Delta Cursor icon and select two points where the
difference in concentration is needed. A green area will appear between
the two points and the min and max value in concentration will be
displayed, see Figure 4.22.
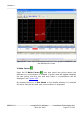
By double-clicking on a Gas Name in the middle window it is selected
for which Gas the min and max concentrations is displayed.