
User guide


Chapter 4
_________________________________________________________________________
________________________________________________________________________
BE6027-12 LumaSoft Gas Software LumaSense Technologies A/S
7810 and 7860 Page 58 of 194
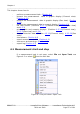
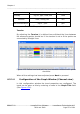
AutoScaleMinAndMax
The scale will cover from the
lowest measurement value to the
highest measured value, i.e. all
measurement points will be
visible on the graph.
AutoScaleMax
The Y-axis will begin at 0 and the
maximum value depends on the
highest measured value.
AutoScaleOff
The user defines both minimum
and maximum values for the Y
scale manually, by defining
YScalemin and YScaleMax
. This
can be of use to view
measurement points in a
particular range.
Table 4.1 Shows the possible Scaling types of the Y-axis
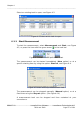
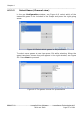
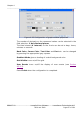
Units
In the Unit column the unit in which each gas will be displayed in the
graphical window can be selected.
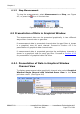
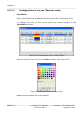
Figure 4.14 Select the unit in which the gas concentrations will be
displayed
Table 4.2 shows the possible parameter units and their default settings.