
User guide

Chapter 4
_________________________________________________________________________
________________________________________________________________________
BE6027-12 LumaSoft Gas Software LumaSense Technologies A/S
7810 and 7860 Page 111 of 194
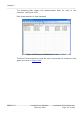
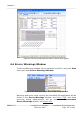
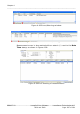
The following tabs shows the measurement data for each of the
channels, see Figure 4.88.
Each measurement is time stamped.
Figure 4.88 Channel measurement data in Excel.
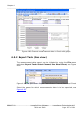
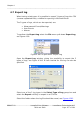
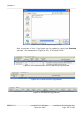
The Excel Chart wizard can now be used to generate for instance a line
graph as shown in Figure 4.89.