Instruction Manual for LumaSoft Gas Software 7810 and 7860 BE6027-12
Index _________________________________________________________________________ Index Index ................................................................................................................................. 2 Safety Considerations ............................................................................................................. 4 Safety Considerations. ......................................................................................................... 5 Warnings!.............
Index _________________________________________________________________________ 4.2.1.2 Select Gases (Channel view) ............................................................................ 55 4.2.1.3 Configuration of curves (Channel view) ............................................................. 56 4.2.1.4 Configuration of the Graph Window (Channel view) ............................................. 59 4.2.1.5 The Graphical Window (Channel view) ......................................................
Safety Considerations _________________________________________________________________________ Safety Considerations October 2012 ________________________________________________________________________ BE6027-12 LumaSoft Gas Software LumaSense Technologies A/S 7810 and 7860 Page 4 of 194
Safety Considerations _________________________________________________________________________ Safety Considerations. Throughout this manual Monitor is used for: Photoacoustic Gas Monitor – INNOVA 1412i Photoacoustic Gas Monitor – INNOVA 1314i LumaSense SF6 Leak Detector - 3434i The Monitor complies with: • EN/IEC 61010-1, 2nd Edition: Safety requirements for electrical equipment for measurement, control and laboratory use. • Can/CSA-C22.2 No.
Safety Considerations _________________________________________________________________________ • A sufficiently long tube is connected to the air-outlet on the back panel so that the sampled gas is carried away to the open air or to an extraction and/or filtration unit. Warnings! • Avoid water condensation in the Monitor. • Switch off all equipment before connecting or disconnecting their digital interface. Failure to do so could damage the equipment.
Chapter 1 _________________________________________________________________________ Chapter 1 Using this Manual October 2012 ________________________________________________________________________ BE6027-12 LumaSoft Gas Software LumaSense Technologies A/S 7810 and 7860 Page 7 of 194
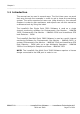
Chapter 1 _________________________________________________________________________ 1.1 Introduction This manual can be used in several ways. The first time users can work their way through the examples in order to get to know the monitoring system. The more experienced users can jump directly to the relevant chapters in order to gain assistance, and experts can use this manual as a reference book by using the index.
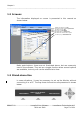
Chapter 1 _________________________________________________________________________ 1.2 Screens The information displayed on screen is presented in this manual as shown below: 1. 2. 3. 4. 5. 6. 7. Menu bar option e.g. File Pull down menu option Export Task Index card e.g. Gas Group e.g. Gas Setup Select Field e.g. Select SIT Check box used to select options Soft-key e.g. Read Filter Info Radio push-buttons: these are not illustrated above, but are commonly used in the software.
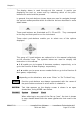
Chapter 1 _________________________________________________________________________ The display above is used through-out this manual. It assists you displaying the text on screen and by indicating which of the pushbuttons can and should be pressed. In general, the push-buttons shown above are used to navigate through the various modes possible within the Monitor but are described in more detail below: S1 S2 S3 These push-buttons are illustrated as S1, S2 and S3.
Chapter 1 _________________________________________________________________________ For further description refer to “BE6025 Instruction Manual, 1412i Photoacoustic Gas Monitor“ 1.4 Tool-bar Icons in LumaSoft Gas Monitoring Software 7810 and 7860 The instructions in this manual use the pull-down menu paths to describe how operations are possible. However, in many cases, the icons in the tool-bars can be used to speed things up. Top Level toolbars and icons are presented in the following sections.
Chapter 1 _________________________________________________________________________ 1.4.
Chapter 2 _________________________________________________________________________ Chapter 2 Preliminary Tasks October 2012 ________________________________________________________________________ BE6027-12 LumaSoft Gas Software LumaSense Technologies A/S 7810 and 7860 Page 13 of 194
Chapter 2 _________________________________________________________________________ When taking delivery of the System three very important and preliminary tasks must be completed before starting to operate it: Install the LumaSoft Gas Software (7810 or 7860) see Section 2.1. Connect the Monitor and the Multiplexer to a PC (Section 2.2). Setting-up User Accounts (Section 2.3). 2.1 Installing the LumaSoft Gas Single Point (7810) or Multi Point (7860) Monitoring Software 2.1.
Chapter 2 _________________________________________________________________________ 2.1.2 Installing LumaSoft Gas The LumaSoft Gas software is delivered on a CD with an installation program. Please refer to Appendix A how to perform the installation of the LumaSoft Gas software. It is recommended that your system administrator performs the task of installing the LumaSoft Gas program. After the installation is successfully completed the LumaSense -> LumaSoft Gas program menu is created.
Chapter 2 _________________________________________________________________________ 2.2.1 Setting the USB Communication Parameters No setup on the 1412i/1314i/3434i gas monitor is necessary in order to be able to communicate with the 1412i/1314i/3434i gas monitor through an USB connection. 2.2.3 Fitting the Ethernet (TCP/IP) Cable.
Chapter 2 _________________________________________________________________________ 3. Here you can select whether the IP address of the 1412i/1314i/3434i gas monitor is to be assigned by a DHCP server in the local network. If you want the 1412i's, 1314i's or 3434i's IP address to be assigned by the DHCP server press the Yes key, where after you will proceed to the below step 6, as the IP address is set by the DHCP server.
Chapter 2 _________________________________________________________________________ 1412i'S IP PORT NUMBER: 23 CANCEL DEFAULT 7. Now you can change the IP port number by using the ▲ and ▼ keys. The port number can be set in the range from 0 to 32767. In case you want to return to the start value of the IP port number press the CANCEL key. In case you want to return to the default stored value of the IP port number press the DEFAULT key. When you have set the IP port number, press the ↵ key.
Chapter 2 _________________________________________________________________________ CURRENT DHCP ADDRESS 192.168.000.062 ACCEPT 10. Here the IP address of the 1412i/1314i/3434i, which has been assigned by the DHCP server is displayed. This IP address can be used to manually set TCP/IP communication in a PC application, which accesses the 1412i/1314i/3434i gas monitor. Press the ACCEPT key to accept. 11. This concludes the setup of the TCP/IP parameters of the 1412i/1314i/3434i gas monitor.
Chapter 2 _________________________________________________________________________ Baud rate 9600 Stop bits 1 Data bits 7 Parity Even Hardwire mode Leased line Handshake type Hardwire Table 2.2 Monitor RS232 communication parameters These are set as the default values in the Monitor. To prevent communication errors, the text line terminator, print data log and print error log must be set as shown in Table 2.3. Text line Terminator CR-LF Print Data Log NO Print Error Log NO Table 2.
Chapter 2 _________________________________________________________________________ The Monitor and the LumaSoft Gas Monitoring Software are now able to communicate together. 2.2.8 Checking/Changing Monitor. the Text line Terminator in the The Text line Terminator must be set using the push-buttons on the front of the Monitor. Press SET-UP S2 ▼S3 Press SET-UP to exit the set-up mode 2.2.9 Selecting the PC communication Port It is just a simple case of selecting the correct port on the PC.
Chapter 2 _________________________________________________________________________ Decimal Address DIP switch setting (looking onto rear) 1309 multipoint sampler 15 00001111 1 13 00001101 2 Table 2.4 Setting the 1309 address 2.2.11 Setting up a Multipoint System with Multipoint Sampler and Doser - INNOVA 1303. The 1303(s) is connected to the Gas Monitor using IEEE-488 cable(s).
Chapter 2 _________________________________________________________________________ The default administrator password is: Administra Figure 2.2 Login dialogue window To create new users you can either select the Manage User icon from the toolbar or select Manage User from the User pull down menu, see Figure 2.3. Figure 2.3 User pull-down: Manage User The User Accounts window appears showing a list of the current user accounts, see Figure 2.4.
Chapter 2 _________________________________________________________________________ The Add New User window appears (see Figure 2.5). Figure 2.5 Add User Account The User Name, Password and Access Level for the new user account can be specified. Please note that the User Name and Password must contain at least 6 characters and must contain no special characters. Only alphabets and numeric characters are allowed [(a-z), (A-Z), (0-9)] for the User Name and Password (see Figure 2.6). Figure 2.
Chapter 2 _________________________________________________________________________ Access level Rights Super All expert rights Delete task Expert All operator rights Create a new task Make setup of a task Backup/restore a task Operator Open a task. Start a measurement Export a task Export log Export/import a task configuration Table 2.6 User access levels 2.3.2 Edit User Account Figure 2.
Chapter 2 _________________________________________________________________________ Figure 2.9 Reset password dialogue The Reset Password dialogue window appears and the new password for the user account can be entered. (See Figure 2.9). 2.3.3 Remove User Account Figure 2.10 User Accounts: Remove A user account can be removed by selecting the Remove soft-key in the User Accounts window, see Figure 2.10. Before selecting the Remove soft-key a User Name must be selected in the User Accounts window. 2.3.
Chapter 2 _________________________________________________________________________ The Change Password dialogue window (Figure 2.12) appears and the old and new password for the administrator can be entered. Figure 2.12 Change Password dialogue 2.4 Download of the latest version You will find the latest version of the software on http://innova.lumasenseinc.com/downloads 2.
Chapter 3 _________________________________________________________________________ Chapter 3 Set-up Measurement Task October 2012 ________________________________________________________________________ BE6027-12 LumaSoft Gas Software LumaSense Technologies A/S 7810 and 7860 Page 28 of 194
Chapter 3 _________________________________________________________________________ This chapter will show the steps how to set-up a measurement task. Please note that measurement set-up is only allowed for users with Expert or Super access level. (See Table 2.6) Log in to the software using your username and password. Figure 3.1 User Authentication 3.1 New task Please make sure that you have an USB, Ethernet (TCP/IP) or a RS-232 interface cable connected to the 1412i/1314i/3434i Gas Monitor device.
Chapter 3 _________________________________________________________________________ If the 1412i/1314i/3434i device is recognized the New Task window (Figure 3.3) opens, where you enter the name of the new task and press the OK soft-key. After that you can proceed to section 3.2. Figure 3.3 Type in the name of the new task. If the 1412i/1314i/3434i device is NOT recognized the Communication Error message box (Figure 3.4) will appear. Press the OK soft-key. Figure 3.4 Communication Error message box.
Chapter 3 _________________________________________________________________________ 3.1.1 Configuration of the USB interface The System Configuration Setup window appears. Now you select the USB radio button as shown in figure 3.5 in case it is not selected. Figure 3.5 Select the USB communication interface. To close the System Configuration Setup press the OK soft-key.
Chapter 3 _________________________________________________________________________ Figure 3.6 The 1412i USB driver. 3.1.2 Configuration of the Ethernet (TCP/IP) interface The System Configuration Setup window appears. Now you select the TCP/IP: radio button as shown in figure 3.7 in case it is not selected. Figure 3.7 Select the TCP/IP communication interface.
Chapter 3 _________________________________________________________________________ Enter the IP address of the Gas Monitor into the IP-address field as shown in Figure 3.8. Figure 3.8 Enter the IP Address of the Gas Monitor. Refer to Section 2.2.4 to find the IP address of the 1412i/1314i/3434i Gas Monitor. Press the OK soft-key to close the System Configuration Setup window. Proceed to Section 3.2 in order to create a new task. If the creation of a new task failed the following message box will appear.
Chapter 3 _________________________________________________________________________ Make sure that the PROTECTED IP ADDRESS either is set to the IP Address of your PC or set to 000:000:000:000. Make a note of the IP Address of the 1412i/1314i/3434i device as displayed in the TCP/IP settings. Your Administrator can now open a DOS Command Prompt to check for a ping reply from the IP Address of the 1412i/1314i/3434i device. Figure 3.10 Ping reply from the 1412i/1314i/3434i device.
Chapter 3 _________________________________________________________________________ 3.1.3 Configuration of the RS-232 interface The System Configuration Setup window appears. Now you select the COM Port: radio button as shown in figure 3.11 in case it is not selected. Press the OK soft-key. Figure 3.11 Select the RS-232 communication interface. Select the Scan Network pull-down menu (Figure 3.12). Figure 3.
Chapter 3 _________________________________________________________________________ A search for a 1412i/1314i/3434i Gas Monitor connected to the RS-232 interface is now performed. When found the Scan Network window is shown (Figure 3.13). Press the New Task soft-key. Figure 3.13 Scan Network: COM2 port found Now the New Task window opens (Figure 3.14). Enter the desired name for your task and press the OK soft-key. You can now proceed to Section 3.2. Figure 3.
Chapter 3 _________________________________________________________________________ 3.2 Measurement set-up The set up of a new measurement task is carried out in five steps. 3.2.1 Configuration First step is System Configuration Setup, select Configuration in the icon from the task Set Up pull down menu (Figure 3.15) or select the bar. Figure 3.15 Set-up pull-down: Configuration The following System Configuration Set Up window will appear. Figure 3.
Chapter 3 _________________________________________________________________________ 3.2.2 Monitor Setup Set up of the Monitor is done by selecting Monitor in the Set Up pull down menu. (Figure 3.17) Figure 3.17 Set up pull-down: Monitor The Monitor Setup will appear. (Figure 3.18) Figure 3.18 Monitor Setup, Sampling Sampling Index Card In the Flushing group box select if the flushing of the instrument should be Auto or Fixed Time.
Chapter 3 _________________________________________________________________________ By selecting Auto the monitoring system controls the flushing by selecting the optimum flushing time. This time can vary as the option takes into account the cleanness of the external air filters and the length of the sampling tube. Type in the length of the tubing. (See Figure 3.18). Selecting Fixed Time allows the user to define a flushing time for chamber and tubing. Table 3.
Chapter 3 _________________________________________________________________________ Figure 3.19 Monitor Setup, Gasses to be measured The calibrations in the Monitor will appear as Gas A, B, C, D and E, see Figure 3.20. Select the gasses which should be measured by using the checkboxes.
Chapter 3 _________________________________________________________________________ Figure 3.20 Monitor Setup Also select the Sample Integration Time (SIT) to be used in the measurements and press OK. To select different SIT’s for different gases use the Sample Integration Time field selection and select Advanced. A select field appears for each gas, see Figure 3.21. Then it is possible to define a SIT for individual gases.
Chapter 3 _________________________________________________________________________ Figure 3.21 By selecting Advanced the user can define SIT for the different gases 3.2.3 Multiplexer setup If a multiplexer is connected to the Monitor select Multiplexer in the Set Up pull down menu. (See Figure 3.22) Figure 3.
Chapter 3 _________________________________________________________________________ Figure 3.23 Multiplexer SetUp Select the channels from which the multiplexer should draw air samples. For each channel a specific location or name can be assigned. Choose between a Normal sequence and a User sequence. By selecting a normal sequence (see Figure 3.23), air samples will be drawn first from channel 1 then 2, 3, 4 etc., that is in ascending order.
Chapter 3 _________________________________________________________________________ Figure 3.24 User defined sample sequence 3.2.4 Alarms This function is used to define software alarms for each gas when the concentration reaches either a minimum or a maximum level. Figure 3.25 Set Up pull-down: Alarm Select Alarm in the Set Up pull down menu, and the following window will appear, Figure 3.26.
Chapter 3 _________________________________________________________________________ Figure 3.26 Alarm Setup for specific gases First select the channel number in the field selection box for which the alarm should be configured, as shown in Figure 3.27. Figure 3.27 Select a channel number in the left pull down box.
Chapter 3 _________________________________________________________________________ Then select the gas for which the alarm should be configured in the Gas selection box, see Figure 3.28. Figure 3.28 Select for which gas the alarm should be configured There are four different alarms which can be configured: Low, Low Low, High and High High. The Low alarm can be set to give a warning that the concentration of the gas is dropping below the normal level.
Chapter 3 _________________________________________________________________________ To set up an alarm first select between the four mentioned alarms, select concentration unit, and then type in the concentration, se Figure 3.29. Figure 3.
Chapter 3 _________________________________________________________________________ When the alarms have been configured choose whether there should be a PC beep when the alarm level is reached. Press Add soft-key to add the configured alarms and then OK to proceed. (See Figure 3.30) Figure 3.30 Press Add soft-key to add the configured alarms To remove a gas from the alarm list highlight the gas using a mouse click and press the Remove soft-key. (See Figure 3.
Chapter 3 _________________________________________________________________________ 3.2.5 Units Select Unit in the Set Up drop down menu. (See Figure 3.31) Figure 3.31 Set Up pull-down: Unit Figure 3.32 Select in which units the data should be displayed In this window the user can select in which units Humidity, Pressure, Gas Concentration, Temperature and Length will be shown. The Normalization Temperature can also be changed.
Chapter 4 _________________________________________________________________________ Chapter 4 Perform Measurement October 2012 ________________________________________________________________________ BE6027-12 LumaSoft Gas Software LumaSense Technologies A/S 7810 and 7860 Page 50 of 194
Chapter 4 _________________________________________________________________________ This chapter shows how to - perform a measurement task. (Section 4.1) present the measurement data in graphic display (Channel view). (Section 4.2.1) present the measurement data in graphic display (Gas view). (Section 4.2.2) present the measurement data in numeric display. (Section 4.3) set user events. (Sections 4.2.1.7{Channel view}, 4.2.2.8{Gas view} and 4.3.3) print graphic and numeric displays. (Sections 4.2.1.
Chapter 4 _________________________________________________________________________ Select an existing task to open, see Figure 4.2. Figure 4.2 Select which task to open 4.1.1 Start Measurement To start the measurement, select Measurement and Start, see Figure 4.3, or press the icon with the green arrow in the task bar. Figure 4.3 Measurement pull-down: Start The measurement can be started immediately (Now option) or at a specific starting time by using the option: Start at, see Figure 4.4. Figure 4.
Chapter 4 _________________________________________________________________________ 4.1.2 Stop Measurement To stop the measurement, select Measurement and Stop, see Figure 4.5, or press the icon in the task bar. Figure 4.5 Measurement pull-down: Stop 4.2 Presentation of Data in Graphical Window The measurement data can be presented graphically in two different ways either channel-wise or gas-wise. If measurement data is presented channel-wise the gas filters is shown in a graphical view for each channel.
Chapter 4 _________________________________________________________________________ 4.2.1.1 Configuration of the (Channel-View) graphical window In the Configuration window select if the data should be presented as a Real Time Graph, while measurement is in progress, or Historical Graph, see Figure 4.7. Figure 4.7 Select if the data should be presented in real time or historic Real Time Graph means that measurement data will be plotted as they arrive from the Monitor.
Chapter 4 _________________________________________________________________________ 4.2.1.2 Select Gases (Channel view) In the gas Configuration window, see Figure 4.8, select which of the measured gases to be included in the Graph and press the right going arrow. Figure 4.8 Select which gasses to be presented To select more gasses at one time press Ctrl while selecting. When the gases have been chosen they will appear in the right window, see Figure 4.9. Press Next to proceed. Figure 4.
Chapter 4 _________________________________________________________________________ 4.2.1.3 Configuration of curves (Channel view) CurveColor Each of the filters has a default selected curve color, see Figure 4.10. To change the color of the curves press the colored square in the CurveColor column. Figure 4.10 Change the color of the curves Select a color for the curve in the Color window, see Figure 4.11. Figure 4.11 Select a color for the curve Repeat the procedure for all the gasses.
Chapter 4 _________________________________________________________________________ PointStyle It is possible to change the style of the plotted measuring points to Square or Circle using the field selection in the Point Style column. Figure 4.12 Change the style of the measurement points Scaling The scaling on the Y-axis can be set to AutoScaleMinAndMax, AutoScaleMax or AutoScaleOff in the field selection individually for each filter in the Scaling column.
Chapter 4 _________________________________________________________________________ AutoScaleMinAndMax The scale will cover from the lowest measurement value to the highest measured value, i.e. all measurement points will be visible on the graph. AutoScaleMax The Y-axis will begin at 0 and the maximum value depends on the highest measured value. AutoScaleOff The user defines both minimum and maximum values for the Y scale manually, by defining YScalemin and YScaleMax.
Chapter 4 _________________________________________________________________________ Parameters Units mg/m3, ppm, Tdew, kPa Humidity Default Unit Tdew Pressure mbar, mmHg, kPa kPa Gas Concentrations mg/m3, ppm ppm Table 4.2 The possible parameter units with defaults Tension By adjusting the Tension it is defined how soft/hard the lines between the measuring points should be. If the tension is set to 0 the points are connected by straight lines. Figure 4.
Chapter 4 _________________________________________________________________________ Figure 4.16 Configuration of graph window properties The number of decimals on the measured values can be selected in the field selection: Y Axis Decimal places. The time interval (X Interval) on the X-axis can be set to days, hours, minutes or seconds. Back Color, Cursor Color, Text Color and Font etc. can be changed by pressing the appropriate grey squares. Gradient Mode gives a shading of a dark background color.
Chapter 4 _________________________________________________________________________ Figure 4.17 The graphical window(Channel View) Changing the configuration To change any of the above settings after the configuration is ended press the right mouse button while the cursor is placed in the graph area. Select Setup (see Figure 4.18) and the Configuration window will appear, see Figure 4.10 and Figure 4.16.
Chapter 4 _________________________________________________________________________ Figure 4.18 To change the configuration in the graphical window press the right button on the mouse To add a curve for a measured gas, which has not been previously added, press the right mouse button while the cursor is placed in the graph area and select AddTag. (See Figure 4.18) 4.2.1.5 The Graphical Window (Channel view) The graphic window shows the measurement data in a graph.
Chapter 4 _________________________________________________________________________ The user can toggle between the Errors/Warnings, Measurement Errors/Warnings and Measurement Alarm windows. The Errors/Warnings window will register if any errors have occurred while running the measurement. The window can be hidden by pressing Auto Hide icon, or by selecting Errors/Warnings Window in the View drop down menu, see Figure 4.19. Figure 4.19 View pull-down: Errors/Warnings Window 4.2.1.
Chapter 4 _________________________________________________________________________ Figure 4.20 Select two measurement points on the same curve to get the difference in concentration Historical Data Plotting Historical data plotting is described in Section 4.2.1.9. X Delta Cursor Press the X Delta Cursor icon and select two points to determine the difference in time. A light red area will appear between the two points and the time difference will be displayed, see Figure 4.21.
Chapter 4 _________________________________________________________________________ Figure 4.21 Select two measurement points in the graphic window to get the difference in time Y Delta Cursor Press the Y Delta Cursor icon and select two points where the difference in concentration is needed. A green area will appear between the two points and the min and max value in concentration will be displayed, see Figure 4.22.
Chapter 4 _________________________________________________________________________ Figure 4.22 Select two measurement points in the graphic window to get the min and max concentrations Cursor On/Off The Cursor function will give the user opportunity to see the exact measurement values for any given measurement point. Drag the cursor to a specific measurement point and the values will be displayed in colored boxes, see Figure 4.23.
Chapter 4 _________________________________________________________________________ Figure 4.23 Drag the cursor to the measurement point to view the measurement data Delete Delta Cursor A X or Y Delta Cursor can be deleted by pressing this icon . The window below will appear and the desired cursor can be selected and deleted by pressing Delete, see Figure 4.24. Figure 4.
Chapter 4 _________________________________________________________________________ Zoom This function enables the user to zoom in and out on areas of particular interest on the graph by using the two icons: Zoom In and Zoom Out . Scroll If a measurement is running over a longer period of time, these icons can be used to scroll the x axis forth or and back or . Expand/Compress These two icons can be used to expand and compress the x-axis.
Chapter 4 _________________________________________________________________________ Figure 4.25 Select a channel number in the select field box 4.2.1.7 User Events in the graphical window (Channel view) If an event occurs or a changed condition happened during a measurement task, it is possible to indicate this event by using the User Event function.
Chapter 4 _________________________________________________________________________ Figure 4.26 Insert User Event by pressing the right mouse button. The following window, see Figure 4.27, will appear to add a comment to be displayed for this specific user event. Figure 4.27 Add a comment to be displayed for the user event Press OK to proceed. The user event which has been set up will be shown as an envelope right beside the measurement point, to which it belongs.
Chapter 4 _________________________________________________________________________ A user event can be updated or deleted by pressing the right mouse button while placing the cursor on the envelope and selecting either Update UserEvent or Delete UserEvent. 4.2.1.8 Printing the graphical window(Channel view) The graphical window can be output to a printer by right-clicking with the mouse button anywhere inside the graphical window to get the print-menu. Select either Print or Print Preview, see Figure 4.
Chapter 4 _________________________________________________________________________ Figure 4.
Chapter 4 _________________________________________________________________________ 4.2.1.9 Displaying historical data (Channel view) Open an existing task by selecting Open Task or Open Task Offline in the File drop down menu, see Figure 4.30. The Open Task Offline allows opening a task without a Monitor connected. Figure 4.30 File menu: Open Task/Open Task Offline The desired task can be opened, see Figure 4.31. Figure 4.31 Open Task list.
Chapter 4 _________________________________________________________________________ Figure 4.32 File menu: Task Contents. Figure 4.33 Contents window The historical data can be displayed by selecting Graphical Window>Single Channel with Selected Gases View in the View drop down menu, see Figure 4.34, then press the Historical Data Plotting icon . Figure 4.
Chapter 4 _________________________________________________________________________ A specific time interval can be selected by entering date and time in the two fields: From Date and To Date, see Figure 4.35. Figure 4.35 Select time interval for historic data plotting. Click OK to display the historical data in a graph. The functions of the icons in the historical window are the same as in the Real Time Window described in Section 4.2.1.6.
Chapter 4 _________________________________________________________________________ 4.2.2.1 Configuration of the (Gas-View) graphical window In the Configuration window select if the data should be presented as a Real Time Graph, while measurement is in progress, or Historical Graph, see Figure 4.37. Figure 4.37 Select if the data should be presented in real time or historic Real Time Graph means that measurement data will be plotted as they arrive from the Monitor.
Chapter 4 _________________________________________________________________________ 4.2.2.2 Select Channels (Gas view) In the channel Configuration window, see Figure 4.38, select which of the channels to be included in the Graph and press the right going arrow. Figure 4.38 Select which channels to be presented To select more channels at one time press Ctrl while selecting. When the channels have been chosen they will appear in the right window, see Figure 4.39. Press Next to proceed. Figure 4.
Chapter 4 _________________________________________________________________________ 4.2.2.3 Configuration of curves (Gas view) CurveColor Each of the channels has a default selected curve color, see Figure 4.40. To change the color of the channel press the colored square in the CurveColor column. Figure 4.40 Change the color of the curves Select a color for the curve in the Color window, see Figure 4.41. Figure 4.41 Select a color for the curve Repeat the procedure for all the gasses.
Chapter 4 _________________________________________________________________________ PointStyle It is possible to change the style of the plotted measuring points to Square or Circle using the field selection in the Point Style column. Figure 4.42 Change the style of the measurement points Tension By adjusting the Tension it is defined how soft/hard the lines between the measuring points should be. If the tension is set to 0 the points are connected by straight lines. Figure 4.
Chapter 4 _________________________________________________________________________ 4.2.2.4 Configuration of filters (Gas view) Scaling The scaling on the Y-axis can be set to AutoScaleMinAndMax, AutoScaleMax or AutoScaleOff in the field selection individually for each filter in the Scaling column. The possible scaling types are described in Table 4.3. Figure 4.44 Setting the scaling of the axis AutoScaleMinAndMax The scale will cover from the lowest measurement value to the highest measured value, i.e.
Chapter 4 _________________________________________________________________________ Units In the Unit column the unit in which each gas will be displayed in the graphical window can be selected. Figure 4.45 Select the unit in which the gas concentrations will be displayed Table 4.4 shows the possible parameter units and their default settings. Parameters Units mg/m3, ppm, Tdew, kPa Humidity Default Unit Tdew Pressure mbar, mmHg, kPa kPa Gas Concentrations mg/m3, ppm ppm Table 4.
Chapter 4 _________________________________________________________________________ Figure 4.46 Configuration of graph window properties The number of decimals on the measured values can be selected in the field selection: Y Axis Decimal places. The time interval (X Interval) on the X-axis can be set to days, hours, minutes or seconds. Back Color, Cursor Color, Text Color and Font etc. can be changed by pressing the appropriate grey squares. Gradient Mode gives a shading of a dark background color.
Chapter 4 _________________________________________________________________________ Figure 4.47 The graphical window (Gas View) Changing the configuration To change any of the above settings after the configuration is ended press the right mouse button while the cursor is placed in the graph area. Select Setup (see Figure 4.48) and the Configuration window will appear, see Figure 4.40.
Chapter 4 _________________________________________________________________________ Figure 4.48 To change the configuration in the graphical window(Gas View) press the right button on the mouse To change (add or remove) the selected channels, press the right mouse button while the cursor is placed in the graph area and select AddTag. (See Figure 4.48) 4.2.2.6 The Graphical Window (Gas view) The graphic window shows the measurement data in a graph.
Chapter 4 _________________________________________________________________________ Figure 4.49 View pull-down: Errors/Warnings Window 4.2.2.7 Functions in the Graphical Window (Gas View) In the top of the Graphical window the Icon Tool Bar is displayed. The tool bar makes it easier to handle and process the obtained measurement data. The function behind each icon will be explained in the following section.
Chapter 4 _________________________________________________________________________ Figure 4.50 Select two measurement points on the same curve to get the difference in concentration Historical Data Plotting Historical data plotting is described in Section 4.2.2.9. X Delta Cursor Press the X Delta Cursor icon and select two points to determine the difference in time. A light red area will appear between the two points and the time difference will be displayed, see Figure 4.52.
Chapter 4 _________________________________________________________________________ Figure 4.51 Select two measurement points in the graphic window to get the difference in time Y Delta Cursor Press the Y Delta Cursor icon and select two points where the difference in concentration is needed. A green area will appear between the two points and the min and max value in concentration will be displayed, see Figure 4.52.
Chapter 4 _________________________________________________________________________ Figure 4.52 Select two measurement points in the graphic window to get the min and max concentrations Cursor On/Off will give the user opportunity to see the exact The Cursor function measurement values for any given measurement point. Drag the cursor to a specific measurement point and the values will be displayed in colored boxes, see Figure 4.53.
Chapter 4 _________________________________________________________________________ Figure 4.53 Drag the cursor to the measurement point to view the measurement data Delete Delta Cursor A X or Y Delta Cursor can be deleted by pressing this icon . The window below will appear and the desired cursor can be selected and deleted by pressing Delete, see Figure 4.54. Figure 4.
Chapter 4 _________________________________________________________________________ Scroll If a measurement is running over a longer period of time, these icons can be used to scroll the x axis forth or and back or . Expand/Compress These two icons can be used to expand and compress the x-axis. This function can be used to get a better visibility of measurement points lying very close to each other. Start/Pause measurement These two icons allow the user to start new measurements points at any time.
Chapter 4 _________________________________________________________________________ 4.2.2.8 User Events in the graphical window (Gas view) If an event occurs or a changed condition happened during a measurement task, it is possible to indicate this event by using the User Event function. To insert a user event press the right mouse button while placing the cursor on the measurement point where the event should be added and select Add UserEvent, see Figure 4.56. Figure 4.
Chapter 4 _________________________________________________________________________ Press OK to proceed. The user event which has been set up will be right beside the measurement point, to which shown as an envelope it belongs. To display a user event set the cursor at the envelope. A user event can be updated or deleted by pressing the right mouse button while placing the cursor on the envelope and selecting either Update UserEvent or Delete UserEvent. 4.2.2.
Chapter 4 _________________________________________________________________________ The printout contain the curves and a footer with task name, monitor type and serial number, channel number, information about the task setup, statistical data, see Figure 4.59. Figure 4.
Chapter 4 _________________________________________________________________________ 4.2.2.10 Displaying historical data (Gas view) Open an existing task by selecting Open Task or Open Task Offline in the File drop down menu, see Figure 4.60. The Open Task Offline allows opening a task without a Monitor connected. Figure 4.60 File menu: Open Task/Open Task Offline The desired task can be opened, see Figure 4.61. Figure 4.61 Open Task list.
Chapter 4 _________________________________________________________________________ Figure 4.62 File menu: Task Contents. Figure 4.63 Contents window The historical data can be displayed by selecting Graphical Window>Single Gas with Selected Channel View in the View drop down menu, see Figure 4.64, then press the Historical Data Plotting icon . Figure 4.
Chapter 4 _________________________________________________________________________ A specific time interval can be selected by entering date and time in the two fields: From Date and To Date, see Figure 4.65. Figure 4.65 Select time interval for historic data plotting. Click OK to display the historical data in a graph. The functions of the icons in the historical window are the same as in the Real Time Window described in Section 4.2.2.7.
Chapter 4 _________________________________________________________________________ 4.3 Presentation of Data in the Numeric Window To display measurement data numeric select Numeric Window in the View pull-down menu. Figure 4.66 View pull-down: Numeric Window 4.3.1 Configuration of the Numeric Window The Numeric Window Properties consists of two Index cards: Interval and Columns, see Figure 4.67. Figure 4.
Chapter 4 _________________________________________________________________________ Interval Index Card Type in a title for the numeric window in the Window Title box, see Figure 4.67. Choose which time interval on a specific date that should be included in the numeric window. This option enables to define the column length as a period of time. Also the number of decimal places for concentration and pressure values can be selected.
Chapter 4 _________________________________________________________________________ Figure 4.69 Select which gases should be displayed Select unit: this enables to display the desired unit for each gas and for the atmospheric pressure. Click in the select unit field, and the available units for this parameter will be displayed. Figure 4.70 Select the units in which the concentration should be displayed Press Add after each selected parameter, see Figure 4.71.
Chapter 4 _________________________________________________________________________ Figure 4.71 The selected gases are shown in the All Columns field For convenience it is possible to add all the filter parameters using the Add All soft-key, see Figure 4.72. Figure 4.72 All filter parameters added with the Add All soft-key In the All Columns field all component parameters to be displayed in the numeric window must appear.
Chapter 4 _________________________________________________________________________ appears here, but you want to edit the units, then you must remove the existing parameter and add it again with the changed unit. When all the parameters, which should be displayed in the numeric window, have been selected, press OK to proceed. The numeric window is shown, see Figure 4.73. Figure 4.73 The numeric window 4.3.
Chapter 4 _________________________________________________________________________ Auto Hide icon or by selecting Errors/Warnings Window in the View drop down menu, see Figure 4.74. Figure 4.74 View menu: Errors/Warnings Window 4.3.3 User Events in the numeric window If an event occurs or some conditions are changed during a measurement task it is possible to indicate this event by using the User Event function.
Chapter 4 _________________________________________________________________________ The following window will appear, see Figure 4.76. Add a comment which will be displayed for this specific user event. Figure 4.76 Add a comment to be displayed for the user event Press OK to proceed. The user event which has been set up will be shown next to the measurement point, to which it belongs (here the user event “window open” has been added, see Figure 4.77. Figure 4.
Chapter 4 _________________________________________________________________________ Figure 4.
Chapter 4 _________________________________________________________________________ 4.3.4 Printing the numeric window The numeric window can be output to a printer by selecting either the Print or the Print Preview button, see Figure 4.79. The Print option will make a printer output and the Print Preview will make a screen view of the printout. Figure 4.
Chapter 4 _________________________________________________________________________ Figure 4.
Chapter 4 _________________________________________________________________________ 4.4 View Measurement alarms A description of measurement alarms can be found in Section 3.2.4. To show the alarms in the numeric window check the tick box Show Alarm, refer to Figure 4.81. An extra Alarm column for every filter is then shown. If an alarm occurred for a measured value it is shown as either High, High High, Low or Low Low in the Alarm column, see Figure 4.81. Figure 4.
Chapter 4 _________________________________________________________________________ Figure 4.82 View pull-down: Alarms Window The Measurement Alarms view shows the latest occurred software alarms, see Figure 4.83. Figure 4.83 The Measurement Alarms view Each alarm is date and time stamped, with channel number, Gas and filter name, measured value and Alarm type. The Sr No. check box gives the user the opportunity to acknowledge an alarm. 4.
Chapter 4 _________________________________________________________________________ Figure 4.84 File pull-down: Export Task>Select Gases/Channel Excel sheet Select the channels for which measurements data is to be exported, see Figure 4.85. Figure 4.85 Export measurements to Excel format Select the directory where the Excel format file should be stored, see Figure 4.86. The default Excel file name is the name of the current task, which can be altered if desired.
Chapter 4 _________________________________________________________________________ Figure 4.86 Export Excel file dialogue When the export is finished press Close, see Figure 4.85. The export Excel workbook file consists of several tabs. The first tab shows the setup of the Monitor, see Figure 4.87. Figure 4.
Chapter 4 _________________________________________________________________________ The following tabs shows the measurement data for each of the channels, see Figure 4.88. Each measurement is time stamped. Figure 4.88 Channel measurement data in Excel. The Excel Chart wizard can now be used to generate for instance a line graph as shown in Figure 4.89.
Chapter 4 _________________________________________________________________________ Figure 4.89 Channel measurement data in Excel with graph. 4.5.2 Export Task (Gas view) The measurement data export can be initiated by using the File menu pull-down Export Task>Select Channel/Gas Excel Sheet, see Figure 4.90. Figure 4.90 File pull-down: Export Task>Select Channel/Gas Excel Sheet Select the gases for which measurements data is to be exported, see Figure 4.91.
Chapter 4 _________________________________________________________________________ Figure 4.91 Export measurements to Excel format Select the directory where the Excel format file should be stored, see Figure 4.92. The default Excel file name is the name of the current task, which can be altered if desired. Figure 4.92 Export Excel file dialogue When the export is finished press Close, see Figure 4.91. The export Excel workbook file consists of a tab for each gas, see Figure 4.93.
Chapter 4 _________________________________________________________________________ Each measurement is time stamped. Figure 4.93 Gas measurement data in Excel. The Excel Chart wizard can now be used to generate for instance a line graph as shown in Figure 4.94.
Chapter 4 _________________________________________________________________________ Figure 4.94 Gas measurement data in Excel with graph. 4.6 Errors/Warnings Window The Errors/Warnings window can be switched on/off by using the View menu pull-down Errors/Warnings Window. Figure 4.95 View pull-down: Errors/Warnings Window Warnings and errors while running the LumaSoft Gas application will be shown in the Errors/Warnings window, see Figure 4.
Chapter 4 _________________________________________________________________________ Figure 4.96 Errors/Warnings window Figure 4.97 Measurement Errors/Warnings window Measurement errors is also marked with an asterix (*) next to the Date Time stamp, as shown in Figure 4.98. Figure 4.
Chapter 4 _________________________________________________________________________ 4.7 Export log When having a task open it is possible to export 3 types of logs into CSV (comma separated files), suitable for opening in Microsoft Excel. The 3 types of logs, which can be exported, are: • • • Measurement Errors/Warnings User Events Alarms To perform the Export Log select the File menu pull-down Export Log, see Figure 4.99. Figure 4.
Chapter 4 _________________________________________________________________________ Figure 4.101 Save export log CSV file Also a preview of the 3 log types can be made by using the Preview soft-key. See examples in Figure 4.102, 4.103 and 4.104. Figure 4.102 Measurement Errors/Warnings log preview Figure 4.103 User Events log preview Figure 4.
Chapter 5 _________________________________________________________________________ Chapter 5 Database Management October 2012 ________________________________________________________________________ BE6027-12 LumaSoft Gas Software LumaSense Technologies A/S 7810 and 7860 Page 119 of 194
Chapter 5 _________________________________________________________________________ - Export Task (Section 5.1) Export/Import Task configuration (Section 5.2) Backup/Restore/Delete Task (Section 5.3) Export Log (Section 5.4) 5.1 Export Task To view the data in another format and do further calculations on data, it is possible to export obtained data to Microsoft Excel. Two types exports are available, either channel-wise (see Section 5.1.1) or gas-wise (see Section 5.1.2).
Chapter 5 _________________________________________________________________________ Figure 5.2 File pull-down: Export Task>Select Gases/Channel Excel Sheet The Export Task Figure 5.3 window will appear. Figure 5.3 Select which task to export Select the task to be exported to Excel and the channels from which to view the data. Press OK to proceed.
Chapter 5 _________________________________________________________________________ Figure 5.4 Type in a filename for the excel file Search for a folder where the task should be stored, and type in a name for the task in the field: File Name, see Figure 5.4. The default file name for the excel file is the name of the export task. Press the Save soft-key to save the Excel file, see Figure 5.4. Press Close (see Figure 5.3) when the Excel file has been exported.
Chapter 5 _________________________________________________________________________ Figure 5.5 Excel file: Monitor setup tab. Figure 5.6 Excel file: Measurement data tab.
Chapter 5 _________________________________________________________________________ 5.1.2 Export Task (Gas view) If the LumaSoft Gas application is not started start it and login with username and password. Figure 5.7 User Login Select Export Task>Select Channel/Gas Excel Sheet in the File pull-down menu. Figure 5.8 File pull-down: Export Task>Select Channel/Gas Excel Sheet The Export Task Figure 5.9 window will appear.
Chapter 5 _________________________________________________________________________ Figure 5.9 Select which task to export Select the task to be exported to Excel and the gases from which to view the data. Press OK to proceed. Figure 5.
Chapter 5 _________________________________________________________________________ Search for a folder where the task should be stored, and type in a name for the task in the field: File Name, see Figure 5.10. The default file name for the excel file is the name of the export task. Press the Save soft-key to save the Excel file, see Figure 5.10. Press Close (see Figure 5.9) when the Excel file has been exported. The exported task can be opened in Excel format from the above selected folder.
Chapter 5 _________________________________________________________________________ 5.2 Export/Import Task Configuration The task configuration export makes an export of a task setup into a file in xml format. The advantage is that once a task has been setup and a backup has been made with the export task configuration, it can be reused by doing an import of the task configuration. This saves the work of doing the same setup again. 5.2.
Chapter 5 _________________________________________________________________________ The following window will appear. Figure 5.14 Select a task to export its configuration Select the task for which the configuration is to be exported to a xmlfile. Press OK to proceed. (See Figure 5.14) Figure 5.15 Type in a filename for the xml task configuration file Search for a folder where the xml task configuration should be stored, and type in a name for the task configuration file in the field: File Name.
Chapter 5 _________________________________________________________________________ Press Close when the task configuration file has been saved. (See Figure 5.14) 5.2.2 Import Task Configuration If the LumaSoft Gas application is not started start it and login with username and password. Figure 5.16 User Login Select Import Task Configuration in the File pull-down menu. Figure 5.
Chapter 5 _________________________________________________________________________ Figure 5.18 Select xml configuration file to be imported Select the xml file to import. After having opened the xml file the following message might appear, if the task already exist in the database. Figure 5.19 Task Validation window After pressing the Yes soft-key you can define a new task name for the imported task, see Figure 5.20. Figure 5.
Chapter 5 _________________________________________________________________________ Press the OK soft-key to import the task configuration. 5.3 Backup/Restore/Delete Task This function enables to backup and restore measurement tasks stored in the SQL Server database. The backup will contain both setup and measurement data. Please note that users with the Operator access level cannot make a backup/restore of a task. Also note that only users with the Super access level can delete a task. 5.3.
Chapter 5 _________________________________________________________________________ Figure 5.22 File pull-down: Backup Task A window will appear, showing the available tasks for backup. Figure 5.23 Select task to backup Select the task for which a backup file is to be made, and press OK to proceed.
Chapter 5 _________________________________________________________________________ Figure 5.24 Type in a filename Search for a folder where the task backup file should be stored and type in a file name in the window shown in Figure 5.24. The default file name for the task backup file is the name of the task selected for backup. Press the Save soft-key to save the Backup file. (See Figure 5.24) Press the Close soft-key after the backup. (See Figure 5.
Chapter 5 _________________________________________________________________________ Figure 5.26 Backup folder rights for group Everyone 5.3.2 Restore Task All backup files, made using the Backup Task function, can be restored. If the LumaSoft Gas application is not started start it and login with username and password. Figure 5.27 User Login Select Restore Task in the File pull-down menu (Figure 5.28).
Chapter 5 _________________________________________________________________________ Figure 5.28 File pull-down: Restore Task Configuration Figure 5.29 Select which task to restore In Figure 5.29 select which of the stored tasks to restore and press Open.
Chapter 5 _________________________________________________________________________ In case that the task already exists in the SQL database the following message will appear, where it is possible if desired to confirm the overwriting of the existing task. Figure 5.30 Confirm overwrite when restoring 5.3.3 Delete Task If the LumaSoft Gas application is not started start it and login with username and password. Figure 5.31 User Login Select Delete Task in the File pull-down menu (Figure 5.
Chapter 5 _________________________________________________________________________ A window will appear showing all existing tasks. Figure 5.33 Select which task to delete Select the task which should be deleted and press OK (See Figure 5.33). The following window will pop up to make sure that the user wants to delete the task. Figure 5.34 Press OK if the task should be deleted 5.
Chapter 5 _________________________________________________________________________ Figure 5.35 User Login Select Export Log in the File pull-down menu (Figure 5.36). Figure 5.36 File pull-down: Export Log The Export Log window opens, giving the possibility to export the 2 types of logs, see Figure 5.37. A time interval for the log can also be specified. The User Activities log shows the history for user actions (Figure 5.40). The Errors/Warnings log shows presented for the user (Figure 5.39).
Chapter 5 _________________________________________________________________________ Figure 5.37 Export Log Select one of the 2 log types in the Select Type of Log group box and select the Export soft-key to export to a CSV-file. Select the folder where the log file should be saved, see Figure 5.38 Figure 5.38 Save export log CSV file Also a preview of the 2 log types can be made by using the Preview soft-key. See examples in Figure 5.39 and Figure 5.40.
Chapter 5 _________________________________________________________________________ Figure 5.39 Error/Warnings log preview Figure 5.
Chapter 6 _________________________________________________________________________ Chapter 6 Warning and Error Messages October 2012 ________________________________________________________________________ BE6027-12 LumaSoft Gas Software LumaSense Technologies A/S 7810 and 7860 Page 141 of 194
Chapter 6 _________________________________________________________________________ Warning and Errors occurring during the operation of the LumaSoft Gas application will be shown in 2 windows at the bottom of the application. How to enable the view of these 2 Warning and Error windows is described in Section 4.6. The Warnings and errors occurring during measurement will appear in the Measurement Errors/Warnings window, see Figure 6.1. Figure 6.
Appendix A _________________________________________________________________________ Appendix A Installation Guide October 2012 ________________________________________________________________________ BE6027-12 LumaSoft Gas Software LumaSense Technologies A/S 7810 and 7860 Page 143 of 194
Appendix A _________________________________________________________________________ 1. When installing the LumaSoft Gas software you must be logged in as Administrator that means that you must have “administrator” rights. Please also note that you must have Administrator rights or Power User rights to run the LumaSoft Gas application after installation. 2. Start the installation of LumaSoft Gas. Insert the CD into the CD-drive and wait for auto-start of the CD.
Appendix A _________________________________________________________________________ When “. NET 3.0 Framework” is installed the following window appears. Press Exit to continue.
Appendix A _________________________________________________________________________ 4. The installer will check for the “Windows Installer 3.1” or higher, if it is already installed on target PC or not. It will install the “Windows Installer 3.1” if it is not already installed otherwise it will skip the “Windows Installer 3.1” installations. If “Windows Installer 3.1” is already installed the following window will not appear and you can continue to step 5. in this installation guide.
Appendix A _________________________________________________________________________ Select Continue. After installation of Windows Installer 3.1 tick “Do not restart now” and press Finish.
Appendix A _________________________________________________________________________ 5. The installer will ask you to install “HASP security key driver”. You can skip this if you have “HASP security key driver” already installed on the local PC in a previous LumaSoft Gas. If you select OK, it will start the installation. Select your preferred installation language and press OK. Press Next to continue.
Appendix A _________________________________________________________________________ ________________________________________________________________________ BE6027-12 LumaSoft Gas Software LumaSense Technologies A/S 7810 and 7860 Page 149 of 194
Appendix A _________________________________________________________________________ Choose “I accept the license agreement” and press the Install button. After installing the HASP key driver press Finish.
Appendix A _________________________________________________________________________ 6. The following window will appear. Press the OK button to install the “SQL-Express 2005” database server. In case you already installed the "SQL-Express 2005" database server in a previous LumaSoft Gas installation, you can skip installing it by pressing the Cancel button. Then wait for the installation of the SQL-Express 2005 database to finish.
Appendix A _________________________________________________________________________ 7. The installer will install the DTS server. Press Next to continue. Select the radio button install for Everyone and press Next Select Next to confirm installation of DTS.
Appendix A _________________________________________________________________________ After installation of DTS press Close.
Appendix A _________________________________________________________________________ 8. After successful installation of DTS server the LumaSoft Gas installation will start. Press Next to start installation of LumaSoft.
Appendix A _________________________________________________________________________ Select Next to confirm installation of LumaSoft After installation of LumaSoft press Close.
Appendix A _________________________________________________________________________ 9. The installation of the USB driver for the 1412i Gas Monitor will start. The following window will appear. Press OK to install the USB driver. In case the USB driver has already been installed you can press Cancel.
Appendix A _________________________________________________________________________ 10. Now the LumaSoftGas database will be installed on your local PC. This will take a while. 11. After successful installation of the database the following message appears. 12. Press OK to proceed. Installation of the LumaSoft Gas software was successful if all the installation succeeded. 13. Press OK to finish the installation package setup. 14.
Appendix A _________________________________________________________________________ 15. If you are using Windows XP the following windows will appear. (If not you can proceed to step 19). Select the radio button "No, not this time". Press Next to proceed. 16. Press Next to proceed.
Appendix A _________________________________________________________________________ 17. While installing the USB driver the following window is displayed. 18. When finished installing the USB driver the following window is displayed. Press Finish to leave the USB driver installation. 19. This finalises the installation of the LumaSoft Gas software.
Appendix B _________________________________________________________________________ Appendix B Remote SQL Server database installation October 2012 ________________________________________________________________________ BE6027-12 LumaSoft Gas Software LumaSense Technologies A/S 7810 and 7860 Page 160 of 194
Appendix B _________________________________________________________________________ This appendix explains how to configure LumaSoft Gas to have its database on a foreign PC’s SQL database server. B.1 Remote installation of the LumaSoft Gas database The LumaSoft Gas database, which keeps a store all the task and measurement data, is by default resident on the same PC as the LumaSoft Gas 7810/7860 application.
Appendix B _________________________________________________________________________ On Windows Vista: Select Start-> Computer-> right click-> Properties Select the Computer Name tab. On Windows Vista: Observe “Computer name:” and write it down for later use. Close the System window. Continue with the last line on this page. Click the Change button to open the Computer Name Changes window Observe the Computer name and write it down for later use. Close the windows Computer Name Changes and Computer Name.
Appendix B _________________________________________________________________________ B.3 Restore(Store) the database onto a foreign PC’s SQL Server To install the database on the SQL Server on a foreign PC. After successful installation of the LumaSoft Gas software package the LumaSoft Gas Database Restore utility will appear to restore the LumaSoftGas database. Here you need to restore the LumaSoftGas database.
Appendix B _________________________________________________________________________ If no SQL server database list appears after a while you can select the “Refresh” button to again look for SQL Server database instances. Use the Login Name: sa and Password: Lumasoft1 and press the “Connect” button. After connect you type the Database Name: LumaSoftGas and select the “Restore Database“ button. Please observe that upper and lower case letters in the Database Name is important.
Appendix B _________________________________________________________________________ After successful restore of the database the following message appears.
Appendix B _________________________________________________________________________ B.4 Configure LumaSoft Gas 7810/7860 to use a database on a foreign PC’s SQL Server If you have the SQL Server installed on a remote PC, the Database connection setting must be changed as per the installation of SQL-Express 2005. To do so you need to change the DataBase-Parameter in AppSettings.xml file. You can find this file inside the “Installation Directory\LumaSense\LumaSoft\Bin” directory.
Appendix B _________________________________________________________________________ Name). If the SQL Express database is installed on a foreign PC than LumaSoft Gas software is installed on, then “Server” should be given the name of the foreign PC.
Appendix B _________________________________________________________________________ Save the change. Exit the editor.
Appendix C _________________________________________________________________________ Appendix C OPC Server Tags Only applicable for 7860.
Appendix C _________________________________________________________________________ This appendix contains a list of all the OPC Server tags offered by LumaSoft Gas 7860. These tags will be active when a measurement is running. When running without a Multipoint Sampler the Channel 1 OPC tags will be used for the measurement results. The 7860 OPC server conforms with the OPC DA (Data access) version 3.0 as well as the previous versions 1.0 and 2.0. The name (Prog ID) of the 7860 OPC server is ‘LumaSense.
Appendix C _________________________________________________________________________ Channel 1 Gas E Alarm LL occurred Boolean Channel1/GasE/AlarmLLOccurred/1050500 Channel 1 Filter E alignment error flag Boolean Channel1/FilterE/AlignmentErrorFlag/1050600 Channel 1 Gas W Channel 1 Gas W Channel 1 Gas W Channel 1 Gas W Channel 1 Gas W Float Boolean Boolean Boolean Boolean Channel1/GasW/Concentration/1060100 Channel1/GasW/AlarmHHOccurred/1060200 Channel1/GasW/AlarmHOccurred/1060300 Channel1/GasW/Alar
Appendix C _________________________________________________________________________ Channel 2 Gas W Alarm H occurred Channel 2 Gas W Alarm L occurred Channel 2 Gas W Alarm LL occurred Channel 2 Filter W alignment error flag Channel 2 Pressure Channel 2 Gas Monitor Air flag Channel 2 Gas Monitor Error flag Channel 2 Gas Monitor Warning flag Channel 2 Monitor Display Error Message Channel 2 Monitor Display Warning Message Channel 2 Multiplexer error flag Channel 2 Multiplexer warning flag Channel 2 Multiplex
Appendix C _________________________________________________________________________ Channel 3 Pressure Channel 3 Gas Monitor Air flag Channel 3 Gas Monitor Error flag Channel 3 Monitor Display Error Message Channel 3 Monitor Display Warning Message Channel 3 Gas Monitor Warning flag Channel 3 Multiplexer error flag Channel 3 Multiplexer warning flag Channel 3 Multiplexer error number Channel 3 Multiplexer warning number Channel 3 Multiplexer Error Description Channel 3 Multiplexer Warning Description Chann
Appendix C _________________________________________________________________________ Channel 4 Monitor Display Error Message Channel 4 Monitor Display Warning Message Channel 4 Multiplexer error flag Channel 4 Multiplexer warning flag Channel 4 Multiplexer error number Channel 4 Multiplexer warning number Channel 4 Multiplexer Error Description Channel 4 Multiplexer Warning Description Channel 5 Gas A Concentration Channel 5 Gas A Alarm HH occurred Channel 5 Gas A Alarm H occurred Channel 5 Gas A Alarm L oc
Appendix C _________________________________________________________________________ Channel 5 Multiplexer error number Channel 5 Multiplexer warning number Channel 5 Multiplexer Error Description Channel 5 Multiplexer Warning Description Channel 6 Gas A Concentration Channel 6 Gas A Alarm HH occurred Channel 6 Gas A Alarm H occurred Channel 6 Gas A Alarm L occurred Channel 6 Gas A Alarm LL occurred Channel 6 Filter A alignment error flag Channel 6 Gas B Concentration Channel 6 Gas B Alarm HH occurred Chann
Appendix C _________________________________________________________________________ Channel 7 Gas A Concentration Channel 7 Gas A Alarm HH occurred Channel 7 Gas A Alarm H occurred Channel 7 Gas A Alarm L occurred Channel 7 Gas A Alarm LL occurred Channel 7 Filter A alignment error flag Channel 7 Gas B Concentration Channel 7 Gas B Alarm HH occurred Channel 7 Gas B Alarm H occurred Channel 7 Gas B Alarm L occurred Channel 7 Gas B Alarm LL occurred Channel 7 Filter B alignment error flag Channel 7 Gas C Con
Appendix C _________________________________________________________________________ Channel 8 Gas A Alarm LL occurred Channel 8 Filter A alignment error flag Channel 8 Gas B Concentration Channel 8 Gas B Alarm HH occurred Channel 8 Gas B Alarm H occurred Channel 8 Gas B Alarm L occurred Channel 8 Gas B Alarm LL occurred Channel 8 Filter B alignment error flag Channel 8 Gas C Concentration Channel 8 Gas C Alarm HH occurred Channel 8 Gas C Alarm H occurred Channel 8 Gas C Alarm L occurred Channel 8 Gas C Ala
Appendix C _________________________________________________________________________ Channel 9 Gas B Alarm H occurred Channel 9 Gas B Alarm L occurred Channel 9 Gas B Alarm LL occurred Channel 9 Filter B alignment error flag Channel 9 Gas C Concentration Channel 9 Gas C Alarm HH occurred Channel 9 Gas C Alarm H occurred Channel 9 Gas C Alarm L occurred Channel 9 Gas C Alarm LL occurred Channel 9 Filter C alignment error flag Channel 9 Gas D Concentration Channel 9 Gas D Alarm HH occurred Channel 9 Gas D Ala
Appendix C _________________________________________________________________________ Channel 10 Gas C Concentration Channel 10 Gas C Alarm HH occurred Channel 10 Gas C Alarm H occurred Channel 10 Gas C Alarm L occurred Channel 10 Gas C Alarm LL occurred Channel 10 Filter C alignment error flag Channel 10 Gas D Concentration Channel 10 Gas D Alarm HH occurred Channel 10 Gas D Alarm H occurred Channel 10 Gas D Alarm L occurred Channel 10 Gas D Alarm LL occurred Channel 10 Filter D alignment error flag Channel
Appendix C _________________________________________________________________________ Channel 11 Gas C Alarm LL occurred Channel 11 Filter C alignment error flag Channel 11 Gas D Concentration Channel 11 Gas D Alarm HH occurred Channel 11 Gas D Alarm H occurred Channel 11 Gas D Alarm L occurred Channel 11 Gas D Alarm LL occurred Channel 11 Filter D alignment error flag Channel 11 Gas E Concentration Channel 11 Gas E Alarm HH occurred Channel 11 Gas E Alarm H occurred Channel 11 Gas E Alarm L occurred Channel
Appendix C _________________________________________________________________________ Channel 12 Gas D Alarm H occurred Channel 12 Gas D Alarm L occurred Channel 12 Gas D Alarm LL occurred Channel 12 Filter D alignment error flag Channel 12 Gas E Concentration Channel 12 Gas E Alarm HH occurred Channel 12 Gas E Alarm H occurred Channel 12 Gas E Alarm L occurred Channel 12 Gas E Alarm LL occurred Channel 12 Filter E alignment error flag Channel 12 Gas W Concentration Channel 12 Gas W Alarm HH occurred Channel
Appendix C _________________________________________________________________________ Channel 13 Gas E Concentration Channel 13 Gas E Alarm HH occurred Channel 13 Gas E Alarm H occurred Channel 13 Gas E Alarm L occurred Channel 13 Gas E Alarm LL occurred Channel 13 Filter E alignment error flag Channel 13 Gas W Concentration Channel 13 Gas W Alarm HH occurred Channel 13 Gas W Alarm H occurred Channel 13 Gas W Alarm L occurred Channel 13 Gas W Alarm LL occurred Channel 13 Filter W alignment error flag Channel
Appendix C _________________________________________________________________________ Channel 14 Gas E Alarm LL occurred Channel 14 Filter E alignment error flag Channel 14 Gas W Concentration Channel 14 Gas W Alarm HH occurred Channel 14 Gas W Alarm H occurred Channel 14 Gas W Alarm L occurred Channel 14 Gas W Alarm LL occurred Channel 14 Filter W alignment error flag Channel 14 Pressure Channel 14 Gas Monitor Air flag Channel 14 Gas Monitor Error flag Channel 14 Gas Monitor Warning flag Channel 14 Monitor
Appendix C _________________________________________________________________________ Channel 15 Gas W Alarm H occurred Channel 15 Gas W Alarm L occurred Channel 15 Gas W Alarm LL occurred Channel 15 Filter W alignment error flag Channel 15 Pressure Channel 15 Gas Monitor Air flag Channel 15 Gas Monitor Error flag Channel 15 Gas Monitor Warning flag Channel 15 Monitor Display Error Message Channel 15 Monitor Display Warning Message Channel 15 Multiplexer error flag Channel 15 Multiplexer warning flag Channel
Appendix C _________________________________________________________________________ Channel 16 Pressure Channel 16 Gas Monitor Air flag Channel 16 Gas Monitor Error flag Channel 16 Gas Monitor Warning flag Channel 16 Monitor Display Error Message Channel 16 Monitor Display Warning Message Channel 16 Multiplexer error flag Channel 16 Multiplexer warning flag Channel 16 Multiplexer error number Channel 16 Multiplexer warning number Channel 16 Multiplexer Error Description Channel 16 Multiplexer Warning Descr
Appendix C _________________________________________________________________________ Channel 17 Monitor Display Error Message Channel 17 Monitor Display Warning Message Channel 17 Multiplexer error flag Channel 17 Multiplexer warning flag Channel 17 Multiplexer error number Channel 17 Multiplexer warning number Channel 17 Multiplexer Error Description Channel 17 Multiplexer Warning Description Channel 18 Gas A Concentration Channel 18 Gas A Alarm HH occurred Channel 18 Gas A Alarm H occurred Channel 18 Gas
Appendix C _________________________________________________________________________ Channel 18 Multiplexer error number Channel 18 Multiplexer warning number Channel 18 Multiplexer Error Description Channel 18 Multiplexer Warning Description Channel 19 Gas A Concentration Channel 19 Gas A Alarm HH occurred Channel 19 Gas A Alarm H occurred Channel 19 Gas A Alarm L occurred Channel 19 Gas A Alarm LL occurred Channel 19 Filter A alignment error flag Channel 19 Gas B Concentration Channel 19 Gas B Alarm HH oc
Appendix C _________________________________________________________________________ Channel 20 Gas A Concentration Channel 20 Gas A Alarm HH occurred Channel 20 Gas A Alarm H occurred Channel 20 Gas A Alarm L occurred Channel 20 Gas A Alarm LL occurred Channel 20 Filter A alignment error flag Channel 20 Gas B Concentration Channel 20 Gas B Alarm HH occurred Channel 20 Gas B Alarm H occurred Channel 20 Gas B Alarm L occurred Channel 20 Gas B Alarm LL occurred Channel 20 Filter B alignment error flag Channel
Appendix C _________________________________________________________________________ Channel 21 Gas A Alarm LL occurred Channel 21 Filter A alignment error flag Channel 21 Gas B Concentration Channel 21 Gas B Alarm HH occurred Channel 21 Gas B Alarm H occurred Channel 21 Gas B Alarm L occurred Channel 21 Gas B Alarm LL occurred Channel 21 Filter B alignment error flag Channel 21 Gas C Concentration Channel 21 Gas C Alarm HH occurred Channel 21 Gas C Alarm H occurred Channel 21 Gas C Alarm L occurred Channel
Appendix C _________________________________________________________________________ Channel 22 Gas B Alarm H occurred Channel 22 Gas B Alarm L occurred Channel 22 Gas B Alarm LL occurred Channel 22 Filter B alignment error flag Channel 22 Gas C Concentration Channel 22 Gas C Alarm HH occurred Channel 22 Gas C Alarm H occurred Channel 22 Gas C Alarm L occurred Channel 22 Gas C Alarm LL occurred Channel 22 Filter C alignment error flag Channel 22 Gas D Concentration Channel 22 Gas D Alarm HH occurred Channel
Appendix C _________________________________________________________________________ Channel 23 Gas C Concentration Channel 23 Gas C Alarm HH occurred Channel 23 Gas C Alarm H occurred Channel 23 Gas C Alarm L occurred Channel 23 Gas C Alarm LL occurred Channel 23 Filter C alignment error flag Channel 23 Gas D Concentration Channel 23 Gas D Alarm HH occurred Channel 23 Gas D Alarm H occurred Channel 23 Gas D Alarm L occurred Channel 23 Gas D Alarm LL occurred Channel 23 Filter D alignment error flag Channel
Appendix C _________________________________________________________________________ Channel 24 Gas C Alarm LL occurred Channel 24 Filter C alignment error flag Channel 24 Gas D Concentration Channel 24 Gas D Alarm HH occurred Channel 24 Gas D Alarm H occurred Channel 24 Gas D Alarm L occurred Channel 24 Gas D Alarm LL occurred Channel 24 Filter D alignment error flag Channel 24 Gas E Concentration Channel 24 Gas E Alarm HH occurred Channel 24 Gas E Alarm H occurred Channel 24 Gas E Alarm L occurred Channel
Appendix C _________________________________________________________________________ Gas D SIT Gas E SIT Gas W SIT Normalisation temperature Humidity interference compensation Cross compensation Flushing mode Float Float Float Float Boolean Boolean String Setup/SIT/GasD/50040400 Setup/SIT/GasE/50040500 Setup/SIT/GasW/50040600 Setup/Temperature/Normalisation/50050100 Setup/Compensation/HumidityInterference/50060100 Setup/Compensation/Cross/50060200 Setup/Flushing/Mode/50070100 Tube length Float Setup/Fl
Appendix C _________________________________________________________________________ 7810 7860 LumaSense Technologies A/S Energivej 30 DK-2750 Ballerup, Denmark Tel.:(+45) 44 20 01 00 Fax: (+45) 44 20 01 01 http://www.lumasenseinc.