
User guide

Chapter 1
_________________________________________________________________________________________
_____________________________________________________________________________
BE6020-14 1316A-1 Multi Gas Monitor LumaSense Technologies A/S
Instruction Manual Page 12 of 98
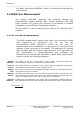
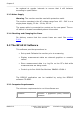
Figure 1.2 Simple NDIR Gas Monitor
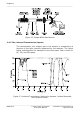
1.4.2 The Infrared Transmission Spectra.
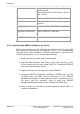
The concentration of a subject gas in the sample is computed as a
function of the light intensity measured by the detector. The figure
below characterizes the absorption and band pass filter curves for
HC, CO, and CO
2
gases.
Figure 1.3 Infrared Transmission Spectra for Hexane, Carbon Monoxide
and Carbon Dioxide.