
Manual


Chapter 8
______________________________________________________________________
_____________________________________________________________________________
BE6030-13 1314i Photoacoustic Gas Monitor LumaSense Technologies A/S
Page 94 of 199
8.2 Printed Monitoring Task Data
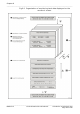
Fig.8.1 illustrates how data from a monitoring task is displayed on
the Monitor’s screen. When monitoring task data appearing in Display
Memory is printed out, the same information appears but it is
presented in a different format. An example of a monitoring task
data print-out is shown in Fig.8.3 – Chapter 10 describes how this is
done.
Fig.8.3 Print-out of monitoring task data
8.2.1 Statistical Analysis Terms
In the statistical analysis of the measurement results for each gas
(see 3 in Fig.8.1) the following statistics appear:
The Mean Value (µ) – this is the linear average of all
measurements of a gas taken during the total monitoring period.
The calculation of “the mean value” can be expressed
mathematically as follows:
The Mean Value =
( )
N
C
Nn
n
n
∑
=
=
=
1
µ