
Switch Release Notes


Analyzing Network Performance Using RMON and Ethernet Statistics (Layer 2 & Layer 3)
17
-
2
Cajun P550/P220 Switch Operation Guide
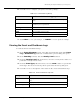
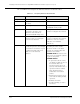
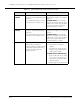
7. Use Table 17-1 to interpret the Ethernet Interface statistical values:
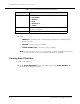
Table 17-1.
Interpreting Ethernet Interface Statistics
Statistic Indicates Actions
Sample
The sample number. N/A
Interval Start
The date and time this log entry
was made.
N/A
Utilization
Percentage of utilization. The percentage of available
bandwidth used by traffic.
Bytes
Raw number of octets received at
the interface. Provides some
indication of the amount of
network bandwidth being used.
A sharp increase could indicate a
need to reconfigure the network.
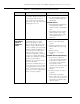
Packets
Counts the raw number of readable
Ethernet packets of legal length
received at the interface.
A sharp increase could indicate a
need to reconfigure the network.
(However, octets are a better
indication of bandwidth
utilization.)
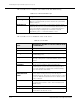
Broadcasts
Broadcast packets are a normal part
of network operation. For example,
IP networks use broadcasts as part
of Address Resolution Protocol
(ARP) to resolve network
addresses.
Uses monitoring to recognize
oncoming broadcast storms.
Broadcast storms occur when
stations are creating traffic that
generates more traffic.
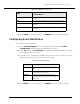
Possible cause:
Broadcasts cause
every host on a network segment
to process the packet.
Possible actions:
• To prevent broadcast storms,
use VLANs to limit the area of
the network that each
broadcast packet affects. In
general, each VLAN creates a
separate broadcast domain.
More VLANs mean less
proliferation of broadcast
packets.
• Monitor the broadcast rate of
your network during normal
operation.
• Establish a baseline.
• Use Rate Limiting to reduce
broadcasts.