
Installation guide


Chapter 2. CLI Syntax Reference
36 3ware SATA+SAS RAID Controller Card CLI Guide, Version 10.2
/cx show dpmstat [type=inst|ra|ext]
The /cx show dpmstat command shows the configuration and setting of the
Drive Performance Monitor and a summary of statistics for drives attached to
the controller.
The optional type attribute specifies which statistics are reported. The
available options are: inst for Instantaneous, ra for Running Average, and ext
for Extended Drive Statistics. If you do not specify a type, you see the default
set of drive statistics, which is the type inst.
inst (Instantaneous). This measurement provides a short duration average.
ra (Running Average). Running average is a measure of long-term averages
that even out the data, which results in older measurement results fading from
the average over time.
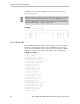
ext (Extended Drive Statistics). The extended drive statistics refers to
statistics of a drive's read commands, write commands, write commands with
Force Unit Access (FUA), flush commands, and a drive sectors's read, write,
and write commands with FUA. Additional statistics are available for drives
at specific ports. For details, see “/cx/px show dpmstat
type=inst|ra|lct|histdata|ext” on page 98.
You can turn Drive Performance Monitoring on and off using the command
“/cx set dpmstat=on|off” on page 62.
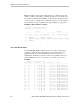
Example of inst drive statistics:
To view a summary of instantaneous data for the set of drives attached to the
controller, use command
/cx show dpmstat. (Because inst is the default, you
do not have to explicitly type it in the command).
Because this is a controller-level command, the output provides summary
information for the set of drives attached to the controller. For statistics about
a drive attached to a specific port, see “/cx/px show dpmstat
type=inst|ra|lct|histdata|ext” on page 98.
In the configuration information shown below, the Performance Monitor is
shown to be ON, Ver sion refers to the firmware version of the Performance
Monitor, Max commands for averaging refers to the maximum number of
commands that can be saved and used for calculating the average, and Max
latency commands to save refers to the maximum number of commands with
high latency that are saved. These configurations and the amount of memory
in the system determine the amount of statistics data in the buffer. These
configuration settings cannot be changed at this time.
//localhost> /c0 show dmpstat
Drive Performance Monitor Configuration for /c0 ...
Performance Monitor: ON
Version: 1
Max commands for averaging: 100
Max latency commands to save: 10
Requested data: Instantaneous Drive Statistics