
Installation guide

Port Object Commands
www.lsi.com/channel/products 99
Monitoring” in the 3ware SATA+SAS RAID Controller Card Software User
Guide, Version 10.2.
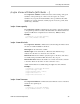
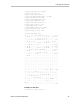
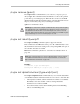
Example of running average (RA) statistics
//localhost> /c0/p3 show dpmstat type=ra
Queue Xfer Resp
Port Status Unit Depth IOPs Rate(MB/s) Time(ms)
--------------------------------------------------------------
p3 OK u0 0 435 25.249 2
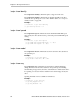
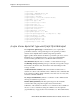
Example of long command times (LCT) statistics
//localhost> /c0/p3 show dpmstat type=lct
Port Status Unit
------------------------------
p3 OK u0
Resp
Date Time Time(ms) --------- CDB / ATA Task File (hex) -----------
---------------------------------------------------------------------------
2007-02-09 13:47:57 383.216 00 80 60 40 92 9f 8a 40 1a 00 00 00 00 00 00 00
2007-02-09 13:47:57 390.809 00 80 60 40 13 eb 30 40 26 00 00 00 00 00 00 00
2007-02-09 13:47:57 405.478 00 80 60 40 61 11 20 40 26 00 00 00 00 00 00 00
2007-02-09 13:47:57 410.379 00 80 60 40 cd 8b b9 40 23 00 00 00 00 00 00 00
2007-02-09 13:47:57 419.002 00 80 60 40 5e df d1 40 29 00 00 00 00 00 00 00
2007-02-09 13:47:57 444.250 00 80 60 40 8b c0 36 40 2e 00 00 00 00 00 00 00
2007-02-09 13:47:57 527.994 00 80 60 40 6e a5 b6 40 03 00 00 00 00 00 00 00
2007-02-09 13:47:57 569.429 00 80 60 40 3b e2 02 40 2d 00 00 00 00 00 00 00
2007-02-09 13:47:57 609.526 00 80 60 40 27 1c e9 40 2b 00 00 00 00 00 00 00
2007-02-09 13:47:57 612.051 00 80 60 40 dd 0b d1 40 2c 00 00 00 00 00 00 00
Note that in addition to the time and date stamps of the commands with the
long response times, their corresponding CDB or ATA Task File is shown.
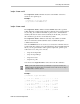
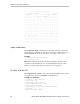
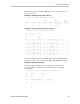
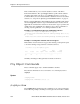
Example of histogram (histdata)
To list a histogram of IOPs grouped together based on response time
associated with the specified port, use command /cx/px show dpmstat
type=histdata.
//localhost> /c0/p3 show dpmstat type=histdata
Port Status Unit
------------------------------
p3 OK u0
Bin Response Time(ms) IO Count
-----------------------------------------------
1 1 0
2 2 0
3 3 0
4 4 0
5 5 0