
User's Manual

32
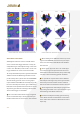
objects and ground conditions will give for example.
Areas of disturbances in the scans will directly lead
to the dierent metals or ground signals and there-
fore can be classied in dierent ways. The operator
therefore can use the scans to his advantage in
order to choose between the metal objects of most
interest only by comparing the dierent scans/
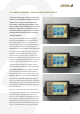
maps. Three delay channels will produce maps with
dierent sensitivity to small and large metal objects,
while giving indications to magnetic soils as well.
Two ground channels will enable the operator to ge-
nerate maps with no ground response but Z dimen-
sions for dierent decay curves of the eddy currents
produced in low or high conducting metal objects.
In addition, the metal classication channel will
display the time delay of the eddy currents of each
signal with a specic colour to give further informa-
tion on the probable kind of metal in the ground. No
matter how strong the ground is mineralized or how
many dierent metals are located in close proximity,
this new device will ensure very good results even
with dicult surrounding conditions. Faults produ-
ced by the operator or the environmental conditions
like overload signals will be immediately seen when
comparing the six channels. In addition GPS data is
also recorded from an optional Battery + GPS mo-
dule to support the user with a compass function a
length measurement of each track and also provides
the coordinates of the starting point of each eld in
the colour maps.
The GPS can be turned on and o when pressing the
BAT/GPS button of the Power Bank for a longer dura-
tion. A green light will ash shortly when GPS is on.
In the case that an additional external GPS is
connected to the Power Bank there will appear
two short green ashes instead of single ashes. If
pressed shortly the battery condition of the Power
Bank will be displayed with four red lights.
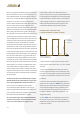
To start the data logger and collect eld data nd
a point in the left corner of the eld and also mark
each corner of the eld you are going to scan.
Fields of 20m x 20m or 10 x 20m make sense. It
makes no sense to scan very narrow elds with three
tracks only! To be sure that there is no overlap simply
use the width of the coil like 1m for a 1mx 1m frame
when walking each track. It is important to proceed
with the tracks from the left to the right since the
visualization software will work the same way!
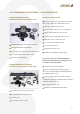
SAVING FIELD DATA WITH THE
LORENZ DEEPMAX Z2 DATA LOGGER
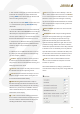
1. Mark a eld in the four corners and start in the
left corner X/Y with a frame coil 1 m x 1 m in size for
example.
2. Turn on the DLOG function with 1 for normal
or 2 for highest Sensitivity. In this mode only a few
functions can be changed or displayed, all the other
functions are shown with a P for preset and cannot
be altered.
3. Keep the coil at the left starting point where X
and Y lines meet and press
ZERO shortly and imme-
diately start to walk the rst track while keeping the
coil at constant height over the ground. A pulsed
beep sound will indicate that the data acquisition is
in progress. Walk at a constant speed while recor-
ding the eld data.
4. Press
ZERO at the end of the rst track in order
to store the same track in the internal memory. A
double tone beep sound will conrm that the data
is stored in memory.
Stop; Endpoint,
press OFF/ FIELD
to save eld data
Start
Start point; Start/Stop by
pressing the ZERO button
Start Start
StartStartStop
Stop Stop
Y
X
Stop