
Smart System User Guide

7
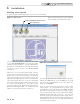
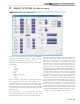
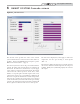
3 SMART SYSTEM Graphics screen
To observe the changes in various readings while the heater
operates, click on the Graphics tab along the top of the Main
Screen window (FIG. 1-1 on page 4). The SMART SYSTEM
Graphics Screen will then appear (see FIG. 3-1 above).
By default, the Outlet Temperature, Inlet Temperature,
System Temperature (if connected), Outdoor Temperature
(if connected), Tank Sensor Temperature (if connected),
Setpoint, Fan Speed, and Flame Signal (current) are plotted.
The current values of these readings are displayed at the top
of the window as depicted in FIG. 3-1.
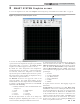
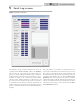
The Channels selections in the upper left corner are all
selected by default. For specific input readings, de-select
undesired fields. Also, these inputs can be viewed individually
by selecting a specific Channel (listed below) at the One Ch.
adjustment in the Grid Setup.
0 = Initially all channels; Clears all channel fields when
changed to 0
1 = Outlet 5 = Flame Signal
2 = Inlet 6 = Tank
3 = System 7 = Setpoint
4 = Outdoor 8 = Fan Speed
The left and right vertical (Y) scales can be changed by
clicking the preferred “magnifying glass” button (+/-), and
return to default by clicking the scale button in between.
Figure 3-1_SMART SYSTEM Graphics Screen
To activate the Left Scale (not default checked) click the box
next to the channel selection (FIG. 3-1). Left Scale CH and
ABS Scale in Grid Setup adjust the unit of measure to the list
below. By default, the Left Scale CH is in degrees Fahrenheit,
while the ABS Scale CH (right side) is RPM. These inputs
can be adjusted for the appropriate unit of measure for each
specific input.
0 = Percent
1-4 = Degrees Fahrenheit
5 = µA (Flame Current)
6 = Degrees Fahrenheit
7 = Voltage
8 = RPM’s
To log data, reference Section 4 - Data Logging on page 8 of
this manual.
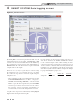
The File and Save section allows you to Save, Delete, Load,
and Print the current trend. Clicking the Save button will
save the trend displayed on the screen. To load a previously
saved trend file, click the Load button (the Load button
is only available when the control is not connected to the
software) and select the desired .trd file. The Delete button
will clear all of the data for the current trend. Once deleted,
the data can no longer be saved. Clicking the Print button
allows you to print the current view.
To access the Graphics Screen, click on the Graphics button along the top of the Main Screen window (FIG. 1-1, page 4).
Check box to activate.
PC Program Instructions