
User guide


LoadVUE User Guide • 7
Loadstar Sensors, Inc. • www.loadstarsensors.com
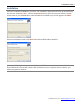
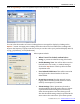
Enter the maximum time-axis range in seconds in the Range field. (Minimum: 5 sec). (You must
close the graph and click on the Graph… button again for this change to take effect.) To stop the
readings from scrolling to the left, click on Anchor the start time. This will show a cumulative graph.
Please note that the cumulative data is limited to only about 10 minutes or so.
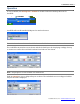
Select Auto on the Load-Axis options for the load axis to scale automatically. You can specify the
maximum and minimum load axis values on the graph by selecting Fixed and entering the values in
the Maximum and Minimum fields.