
Manual

© 2013 Littelfuse, Inc.
64
Revised: October 9, 2013
Varistor Products
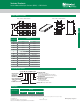
MLN SurgeArray™ Suppressor
Surface Mount Multilayer Varistors (MLVs) > MLN Series
Specifi cations are subject to change without notice.
Please refer to www.littelfuse.com/series/MLN.html for current information.
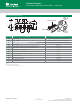
Device Ratings and Specifi cations Any Single Section
NOTES: 1. Tested to IEC61000-4-2 Human Body Model (HBM) discharge test circuit.
2. Direct discharge to device terminals (IEC preffered test method).
3. Corona discharge through air (represents actual ESD event)
4. Capacitance may be customized, contact Sales.
Part Number
Maximum Ratings (125 ºC ) Specifi cations (25 ºC )
Maximum
Continuous
Working
Voltage
Maximum
Non-
repetitive
Surge Current
(8/20μs)
Maximum
Non-
repetitive
Surge Energy
(10/1000μs)
Maximum
Clamping
Voltage (at
Noted 8/20μs)
Current
Typical ESD
Supression Voltage
(Note1)
Nominal Voltage
at 1mA DC Test
Current
Capacitance
at 1 MHz
(1V p-p)
V
M(DC)
I
TM
W
TM
V
C
(Note 2)
8kV Contact
(Note 3)
15kV Air
V
N(DC)
Min
V
N(DC)
Max
(Note 4)
C
Peak Clamp Peak TYP MAX
(V) (A) (J) (V) (V) (V) (V) (V) (V) (pF) (pF)
V5.5MLN41206 5.5 30 0.10 15.5 at 2A 60 35 45 7.10 10.8 430 520
V9MLN41206 9.0 30 0.10 23.0 at 2A 95 50 75 11.0 16.0 250 300
V14MLN41206 14.0 30 0.10 30.0 at 2A 110 55 85 15.9 20.3 140 175
V18MLN41206 18.0 30 0.10 40.0 at 2A 165 63 100 22.0 28.0 100 125
V18MLN41206L 18.0 30 0.05 50.0 at 1A 200 95 130 25.0 35.0 45 75
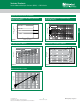
Peak Current and Energy Derating Curve
For applications exceeding 125ºC ambient temperature, the
peak surge current and energy ratings must be reduced.
100
90
80
70
60
50
40
30
20
10
0
-55 50 60 70 80 90 100 110 120 130 140 150
PERCENT OF RATED VALUE
AMBIENT TEMPERATURE (
o
C)
t
t
1
t
2
100
90
50
10
O
1 TIME
PERCENT OF PEAK VALUE
Peak Pulse Current Test Waveform for Clamping Voltage
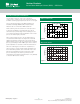
Equivalent Series Resistance
Impedance vs Frequency, 1206 Size
0.1
1
10
100
1000
10000
0.1 1 10 100 1000
Frequency (MHz)
Impeance |Z| (Ω)
V5.5
V9
V14
V18
V18L
1000
1MHz
Frequency
OHMS
100
10
1
0.1
10MHz 100MHz 1GHz 10GH
z
Typical Performance Curves
0
1
= Virtual Origin of Wave
T = Time from 10% to 90% of Peak
T
1
= Rise Time = 1.25 x T
T
2
= Decay Time
(Impulse Duration)
Example:
For an 8/20 μs Current Waveform:
8μs = T
1
= Rise Time
20μs = T
2
= Virtual Time
to Half Value
Figure 1
Figure 2
Figure 3
Figure 4