
Installation Guide


LED Lighting Surge Protection Modules
Design and Installation Guide
© 2016 Littelfuse • LED Lighting SPD Module Design and Installation Guide www.littelfuse.com
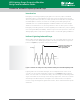
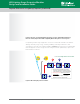
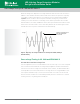
The DOE test waveform used to evaluate surge immunity of luminaires used in outdoor
lighting (Figure 4) is a combination 1.2x50μs open circuit voltage and 8x20μs short circuit
current waveform. To perform this test, the specified peak current is calibrated on the surge
generator by shorting the output to ground prior to connection to the luminaire.
Figure 4. Open-circuit voltage and short-circuit current waveforms to represent transient surges
on an AC power line. Vp and Ip represent the peak voltage and current, respectively.
Regional Differences in Lightning Frequency
Lightning frequency may refer to the number of lightning strikes in a region during a particular
period or to the probability quotient of lightning strike frequency.
Satellite-based Lightning Imaging Sensor (LIS) observations are used to study lightning
activity in different regions of the world. This research has shown clear differences in both
flash frequency and optical radiance in different regions. The flash activity in different regions
shows a clear difference, corresponding to the local climate, topography, and environment
conditions.
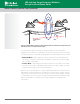
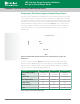
IEEE studied the effect of indirect lightning on outdoor lighting and recommended transient
surge testing levels (3kA and 10kA) for the United States. For other regions for which lighting
survey data and regional regulations aren’t available, NASA’s research on worldwide lightning
strike frequency (Figure 5) may be useful as a reference for comparison. Central and South
America, Africa, Southern and Southeastern Asia have lightning strike frequencies similar
to Florida in the United States, so an equivalent surge immunity level (10kA) is suggested.
For regions with fewer lightning strikes, such as Europe, Eastern Asia, and Australia, a lower
surge immunity level could be considered at 3kA.
1.0
0.8
0.6
0.4
0.2
0
0 20 40 60
Time (µs)
V(t)/Vp
80 100
Duration - 50 µs
Front Time - 1.2 µs
1.0
0.8
0.6
0.4
0.2
0
0 10 20 30
Time (µs)
I(t)/Ip
40 50
Duration - 20 µs
Front Time - 8 µs
Regional Differences in Lightning Frequency
6