
Cov lus qhia


2
03 04 05 07 001
051
002 003 005
007 0001 0002
0003
q
V
]s/l[
2
3
5
7
01
51
02
03
05
07
00
1
05
1
∆
p
t
]aP[
051 002
003
005 007 0001 0002 0003 0005 00001
q
V
m[
3
]
h/
5.0
1 2
3 4
5
7 01
a
2.0
]m[
1 2 3 4 5 7 01 51 02
b
2.0
]m[
ACC
L
AW
)A(Bd
7021
7061
0102
0152
5113 0204 0205
0236
02
52
03
53
04
54
05
55
06
h
v
max
v
a
0,2
b
0,2
a
0,2
a
0,2
2
Size
Centre frequency Hz
63 125 250 500 1K 2K 4K 8K
1207 8 -1 1 1 -9 -17 -28 -40
1607 10 -1 1 1 -8 -17 -29 -33
2010 10 -1 3 0 -9 -17 -27 -40
2510 7 -1 3 0 -7 -18 -28 -41
3115 13 2 3 -1 -8 -17 -29 -27
4020 13 2 3 -1 -7 -16 -28 -43
5020 7 3 2 0 -6 -16 -19 -17
6320 7 3 2 0 -8 -16 -20 -17
Size
Centre frequency Hz
63 125 250 500 1K 2K 4K 8K
1207 19 14 5 3 2 1 2 1
1607 16 12 4 1 2 1 2 2
2010 12 8 4 2 3 2 2 2
2510 12 8 5 2 1 1 1 1
3115 11 8 3 2 1 1 2 2
4020 961111 1 1
5020 641111 1 1
6320 531100 0 1
Under-
temperature
Maximum
velocity Mean velocity
Correction
factor
T
i
-T
r
m/s m/s
0.20 0.10 1.00
0.25 0.12 0.80
-3K
0.30 0.15 0.70
0.35 0.17 0.60
0.40 0.20 0.50
0.20 0.10 1.20
0.25 0.12 1.00
-6K
0.30 0.15 0.80
0.35 0.17 0.70
0.40 0.20 0.60
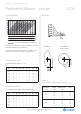
Perforated diffuser - circular CCA
Lindab reserves the right to make changes without prior notice
2020-10-07
lindab | we simplify construction
Technical data Nearzone
Recommended maximum volume flow.
The near zone is given at an under-temperature of -3 K to a
maximum terminal velocity of 0.20 m/s.
Conversion to other terminal velocities - see table 1, correc-
tion of the near zone for -3 K and -6 K respectively.
Sound effect level
Sound effect level L
W
[dB] = L
WA
+ K
ok
Sound attenuation
Sound attenuation ΔL [dB] including end reflection.
Table 1
Correction of the near zone (a
0.2
, b
0.2
)
Oval diffusion Circular diffusion
(factory setting)