
User manual

Document No. 6-0101 Rev. D Page 30 of 38
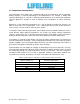
APPENDIX C – CHARTS AND GRAPHS
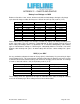
Battery Load Voltage vs. DOD
Below are listed the 1 hour, 8 hour, 20 hour and 120 hour load voltages during the discharge
cycle from full charge to 100% discharge to 1.75V/cell or 10.5V (6 cells) at 25°C (77°F).
DOD (%)
1 hr. Rate
8 hr. Rate
20 hr. Rate
120 hr. Rate
10
12.23
12.60
12.65
12.69
20
12.16
12.51
12.55
12.58
30
12.07
12.39
12.42
12.45
40
11.96
12.25
12.28
12.32
50
11.83
12.11
12.15
12.18
60
11.70
11.98
12.02
12.05
70
11.55
11.79
11.83
11.88
80
11.38
11.59
11.61
11.65
90
11.15
11.32
11.34
11.40
100
10.50
10.50
10.50
10.50
Please note that these voltages are averages and will vary slightly from battery to battery even
of the same rating. They are, however, a good indicator of state of charge and can be used
when setting low voltage alarms or disconnects for a Concorde AGM battery. Other battery
types or manufacturers voltage vs. DOD may be substantially different. The data is for newer
batteries with relatively few cycles. An older battery will measure a lower voltage for a given
DOD.
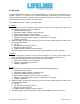
SOC (%) vs. OCV
An easy method to estimate the State of Charge (SOC) of the battery is by measuring its Open
Circuit Voltage (OCV). This measurement should be made after the battery has been at rest for
a minimum of four hours with the battery shut off from its charging source and load. The voltage
is listed as Volts/cell and for a 12V (6 cell) battery at 25°C (77°F).
State of Charge (%)
OCV per cell
OCV per 12V battery
100
2.13 or greater
12.8 or greater
75
2.08
12.5
50
2.03
12.2
25
1.98
11.9
0
1.93 or less
11.6 or less
These voltage levels are approximate and give an indication of the state of charge of a battery
at rest. As the battery ages these voltage measurements will be lower.