
User Manual

Help Manual
88
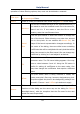
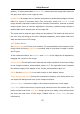
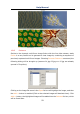
12.8 Line Profile•••
Choose Line Profile••• command to illustrate how pixels along a selected line are
distributed by graphing the number of pixels at each color intensity level.
Choose Measurements>Arbitrary Line, or Measurements> Horizontal Line or
Measurements> Horizontal Line to draw a line on the image and choosing
Process>Line Profile will bring up a Line Profile dialog as below:
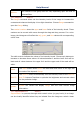
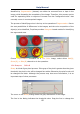
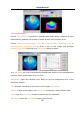
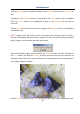
In a Line Profile, the X-axis represents the spatial scale, and the Y-axis represents the
intensity values which range from 0 to 255.
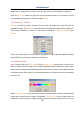
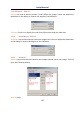
Background: Open the windows color dialog to set the background color of the
histogram window.
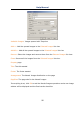
Title: Use this command to set a title on the image's Line Profile.
Capture: Capture the image in the Line Profile window as a new untitled image.
Copy: Copy the Line Profile window's content onto the clipboard.
Save as•••: Save the Line Profile image in bmp format.