
User Manual

Help Manual
72
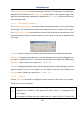
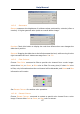
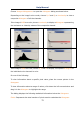
Choose Image>Histogram••• to open the Histogram dialog as shown below.
Depending on the image’s color mode, choose R, G and B, or Luminosity to view a
composite Histogram of all the channels.
If the image is RGB true color, choose Luminosity to display a Histogram representing
the luminance or intensity values of the composite channel.
If the image is RGB true color, choose R, G and B to display a composite Histogram of
the individual color channels in color.
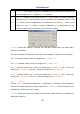
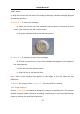
Do one of the following:
To view information about a specific pixel value, place the mouse pointer in the
Histogram.
To view information about a range of values, click down the left mouse button and
drag it in the Histogram to highlight the range.
The dialog displays the following statistical information below the Histogram:
Pixels: Represents the total number of pixels used to calculate the Histogram.