
Manual


Leddar™One Sensing Module 29
4.3. Leddar™ Configuration Main Window
This section describes the elements of the Leddar™ Configurator main
window.
At the top of the window are the menu bar and the toolbar.
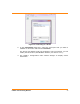
Figure 14: Leddar™ Configuration Main Window
The main area displays the distance of the first detection in numerical form as
well as in a bar in a distance gauge. If present, the second and third detections
will be displayed as thin bars in the gauge (as shown in Figure 14).
The distance gauge is color-coded to represents the detection quality:
yellow for a weak detection
green for a good detection
red for a saturated detection
See section 3.3 for guidelines regarding low and saturated detections.