
Manual


Leddar™One Sensing Module 21
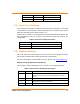
Figure 11: Measurement Stabilization Example
The red line represents the true target distance, the blue curve corresponds
to the target distance measured by the sensor without stabilization, while the
green curve is the stabilized measurements. One could notice that the
measurement precision (standard deviation) is dramatically improved by the
stabilization algorithm.
NOTE: The smoothing algorithm is recommended for applications that need
highly precise measurements of slowly moving objects. For
application that tracks quickly moving objects, it is advised to
decrease the value of the stabilization parameter or to disable the
stabilization algorithm.
3.4. Measurement Rate
The sensor acquires a base input waveform at a rate of 72131 Hz (44MHz/610).
Multiple acquisitions are used to perform accumulations and oversampling, and
generate a final waveform that is then processed to detect the presence of
objects and measure their position.
The final measurement rate is therefore:
Measurement rate = base rate/accumulations/oversampling
For example, with 256 accumulations and an oversampling value of 8:
Measurement rate = 72131 / 256 / 8 = 35.22 Hz
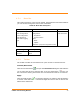
Table 5 presents the measurement rate for typical values of accumulations and
oversampling.
Table 5: Measurement Rate
Accumulation
Oversampling
Measurement rate (Hz)
4096
8
2.20
2048
8
4.40
1024
8
8.81
512
8
17.61
256
8
35.22
128
8
70.44
4096
4
4.40
2048
4
8.81
1024
4
17.61