Leddar™One User Guide LeddarTech Inc. 2740 Einstein Street Quebec, Quebec G1P 4S4 CANADA www.leddartech.
Copyright © 2015 LeddarTech Inc. All rights reserved. The Company shall not be liable for any errors contained herein or for any damages arising out of or related to this document or the information contained therein, even if the Company has been advised of the possibility of such damages. The information contained herein is the property of LeddarTech Inc., and shall not be reproduced in whole or in part without prior written approval of LeddarTech Inc. LeddarTech Inc.
Table of Contents 1. INTRODUCTION ............................................................................................................5 1.1. Description ............................................................................................................................ 5 1.2. Underlying Principles .......................................................................................................... 10 1.3. Signal Processing Algorithm Overview ......................................
5.5. Performance........................................................................................................................ 47 5.6. Regulatory Compliance ....................................................................................................... 51 5.7. Dimensions .......................................................................................................................... 52 6. HELP .................................................................................
1. Introduction The Leddar™One enables developers and integrators to make the most of Leddar™ technology through integration in systems requiring detection and ranging. The Leddar™One Module is a more compact and low-cost alternative that brings valuable sensing intelligence to a whole new range of finished products. 1.1. Description The Leddar™One package contains the sensor module with the following features: 3° conic beam Beam height: 3° Real-time data acquisition (through serial port) 3.
The following is a description of the main components of the Leddar™One.
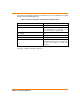
The power and interface signals are included on a six-pin standard 0.1” pitch header with the following pinout: Table 1: Pinout of the Power and Interface Signals Header Pin – Function Description 1 – GND Ground. 2 – IRQ Interrupt Signal, active high. Set when a new measurement is available, reset when data read from Modbus link. 3 – Supply 5V 4 – RX or RS-485+ Serial port input. 5 – TX or RS-485- Serial port output. 6 – RESET_N This is a pulled-up input that must be pulled down below 0.
Push Button The push button at the right of the six-pin interface has three functionalities: Table 2: Push Button Functionalities Description Short press during sensor operation Action Software reboot Short press at power up (less than 10 seconds) Reset sensor configuration. The button must be pressed before powering the sensor and released once power is applied. Long press at power up (more than 10 seconds) Upload a binary file at power-up.
Leddar™One Architecture The following diagram presents the architecture of the module. Figure 2: Working Diagram The Leddar™One module includes the photodetector, LEDs, MCU, the controller for LED pulsing and data acquisition. Data acquisition is performed at a sampling frequency of 72131 Hz (44MHz/610). The Leddar™One module processes the acquired data and produces measurements at a configurable measurement rate. The measurements provide the distance of detected objects in the conic beam.
1.2. Underlying Principles Created by LeddarTech, LEDDAR™ (light-emitting diode detection and ranging) is a unique sensing technology based on LED illumination (in either the visible or the infrared spectrum) and the time-of-flight of light principle. The LED emitters illuminate the area of interest (pulsed at high frequency) and the single channel sensor receiver collects the backscatter of the emitted light and measures the time taken for the emitted light to return back to the sensor.
fit specific application requirements such as detection range, beam and spatial resolution. 1.3.
the signal is captured while the reception lens of the sensor is shielded from the backscattered light. The sensor comes with a static noise factory calibration. However, the default calibration can be updated by the user using LeddarTM Configurator, see Section 4.4.12 for more details. 1.3.3. Pulse Detection The objects in the sensor field of detection create a particular signature in the full-waveform signal called pulses.
1.3.6. Smoothing The smoothing algorithm reduces the distance measurement jitter. It can be seen as a recursive average filter which continuously adapts its cutoff frequency (or averaging history length) as a function of the current measurement noise. This innovative algorithm increases the precision of the device (decreases the standard deviation of the measurements). The level of smoothing of the algorithm can be adjusted to fit the requirements of the user applications, please see Section 3.3.
2. Getting Started 2.1. Setup To configure the sensor and see measurements the Leddar™ Configurator software must be installed. This software is available for download at www.leddartech.com/support. Once you have downloaded the file, simply double-click on it and follow on-screen instructions. Figure 5: Leddar™ Software Setup Dialog Box The installer creates an icon on the computer desktop and in the Start menu. 2.2.
Figure 6: Connecting to a Device 3. In the Connection window, select your serial port and click Connect. Figure 7: Connection Window The main window displays the detections (green bar) in the distance gauge.
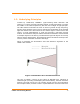
3. Measurement and Settings 3.1. Distance Measurement Distance is measured from the surface of the module PCB. Figure 8: Distance Measurement The dashed lines illustrate the full-beam and the solid line indicates the distance measured by the sensor. 3.2. Data Description Measurement data can be displayed in the Raw Detections window (View menu > Raw Detections).
Figure 9: Raw Detections Dialog Box An object crossing the beam of the sensor is detected and its distance is measured. A measurement contains distance, amplitude, a flags bit field and the segment of the detection. The latter applies to multiple-segment modules and is fixed for the Leddar™One. The quantity of light reflected back to the sensor by the object generates the amplitude. The stronger the reflection, the higher the amplitude.
Figure 10: Acquisition Setting Dialog Box To apply the changes, click the apply button ( ) in the main window. Table 4: Sensor Setting Description Parameters Descriptions Effects Accumulations Number of accumulations Higher values enhance range, reduce measurement rate and noise. Oversampling Number of oversampling cycles Higher values enhance accuracy/ precision/resolution and reduce measurement rate. Points Number of base sample points Determines maximum detection processing range.
The measurement stabilization algorithm is advised for application that need to measure slowly moving objects with a high precision. The application requiring to track quickly moving objects, the stabilization should be configured with a value lower than 0 or simply deactivated. Static Noise Removal Disabling of the static noise removal algorithm The static noise in the full-waveform signal is removed using predefined static noise templates. These templates are determined during the calibration process.
Keeping the sensor in automatic LED power mode ensures it adapts to varying environments. Close range objects may reflect so much light they can saturate the sensor, reducing the quality of the measurements. This mode will adapt the light output within the change delay setting to reach the optimal amplitude. On the other hand, low amplitudes provide lower accuracy and precision.
Figure 11: Measurement Stabilization Example The red line represents the true target distance, the blue curve corresponds to the target distance measured by the sensor without stabilization, while the green curve is the stabilized measurements. One could notice that the measurement precision (standard deviation) is dramatically improved by the stabilization algorithm. NOTE: The smoothing algorithm is recommended for applications that need highly precise measurements of slowly moving objects.
512 4 35.22 256 4 70.44 128 4 140.88 3.5. Serial Port Settings Two settings are available to adjust data acquisition through the 3.3V UART or RS-485 link. The baud rate can be configured to the desired value. Parity, data bits and stop bits are fixed at None, 8, 1. A baud rate of 115200 is recommended to provide the best data transfer rate and measurement rate up to 50Hz. The following serial port settings are configurable.
31 11 The hardware part number as an ASCII string 39 8 The full firmware version as 4 16-bit values 43 4 The firmware 32-bit CRC 47 2 The FPGA version 49 4 Device option flags (LeddarTech internal use) 51 2 Device identification code Write Configuration (function code 0x46) This function writes the current configuration registers to permanent memory. There is no data in input or output.
Read Holding Register (function code 0x3), Write Register (function code 0x6) and Write Multiple Register (function code 0x10) Here are the registers implemented for these commands: Table 9: Read Holding Register Description Address Description 0 Accumulation Exponent (0-12). This register contains the power of 2 of the number of accumulation. For example if this register contains 10, 1024 accumulations will be performed. 1 Oversampling exponent (0-3).
The example is heavily commented and easy to understand. It is a commandline application. It can be used in Windows with VisualStudio 2008 (or later) with the provided solution. It can be used in Linux with the provided Makefile (as long as development tools are installed).
4. Leddar™ Configurator Leddar™ Configurator provides configuration parameters and operation functionalities for the Leddar™One Sensing Module. 4.1. Installing Leddar™ Configurator See section 2.1 for guidelines regarding installation of Leddar™ Configurator. Once the installation is completed, you can connect to the sensor. 4.2. Connecting to the Module To configure the sensor, you must first connect to it. To connect to the sensor: 1.
Figure 12: Connecting to a Device 2. In the Connection dialog box, select the serial port that you want to establish a connection with and click Connect. The device has default serial port parameters. Once connected, you can modify the baud rate or/and ModBus Address (see section 4.4.1). 3. The Leddar™ Configuration main window changes to display sensor information.
Figure 13: Leddar™ Configurator Main Window Leddar™One Sensing Module 28
4.3. Leddar™ Configuration Main Window This section describes the elements of the Leddar™ Configurator main window. At the top of the window are the menu bar and the toolbar. Figure 14: Leddar™ Configuration Main Window The main area displays the distance of the first detection in numerical form as well as in a bar in a distance gauge. If present, the second and third detections will be displayed as thin bars in the gauge (as shown in Figure 14).
4.3.1. Menu Bar This section presents, in the form of a table, the parameters and functionalities you can access through the menus and commands. Table 10: Menu Bar Description File Device View Replay Disconnect State Save Configuration Configuration Raw Detections Load Configuration Acquisition Start Recording Communication Start Data Logging Action Quit Reset Update Calibration (only with integrator license) Settings Help Preferences User Guide Licences About 4.3.2.
Undo Click the undo button ( ) to erases all the changes you have made to the parameters since the last apply action or connection. 4.4. Using Leddar™ Configurator This section presents the procedures to view, configure, and analyze detections from the sensor using Leddar™ Configurator. 4.4.1. Configuring Serial Port The sensor serial port settings are configurable. To open the Communication Settings dialog box, on the Device menu, point to Configuration and click Communication.
4.4.2. Acquisition Settings The acquisition settings allow to define the signal acquisition parameters. To open the Acquisition Settings dialog box, on the Device menu, point to Configuration and click Acquisition. See section 3.3 for a complete description of each setting. Figure 16: Device Menu and Acquisition Settings Dialog Box To apply the changes, click the apply button ( main window. 4.4.3.
Figure 17: File Menu To load a configuration: On the File menu, click Load Configuration and then select a file. Once the file is selected, information on the file will be displayed and the user will be asked if this configuration can be sent to the device. 4.4.4. Configuring Detection Records Detection records provide a playback of detections recorded by a device. This visual information can be useful for verification, troubleshooting, or training purposes.
Figure 19: Record Settings Dialog Box 4. In the Maximum file size box, set the maximum file size by using the arrows or by entering the value manually. The recording stops for the current file once it reaches the maximum file size and automatically switches the recording to another file. This is to keep record files of manageable sizes. 5. Under What, select the Debug check boxes if the recording is to share with Leddartech technical support. This records additional data and results in larger log files.
Figure 20: File Menu To stop a recording manually: On the File menu, click Stop Recording. OR On the computer keyboard, press the key. 4.4.5. Using Detection Records Once you have completed a recording, you can review it and extract part of the recording. The Record Replay dialog box offers the same functions as a regular video player: there is a stop button, a play button, and frame-by-frame forward and backward buttons. The Position slider lets you move directly to a desired position.
Figure 21: File Menu 3. In the Record Replay dialog box, click the browse button to select a file. Browse button Play button Figure 22: Record Replay Dialog Box 4. Click the play button to start the playback. To extract a record file segment: 1. Set the Position slider to the position where you want the file segment to start and click the Start button. 2. Set the Position slider to the position where you want the file segment to stop and click the End button.
4.4.6. Data Logging The data logging function is used to output data to a text file. This file can be imported in a software application, such as Microsoft Excel, for offline analysis. The duration of the logging is indicated in the status bar. Each line of the generated text file contains the information related to a single detection. Table 12: Data Log Field Description Time (msec) Segment [Always 1] Amplitude [0 128] Distance (m) Status 422530 1 127.42 6.
Browse button Figure 24: Data Log Setting Dialog Box 3. On the File menu, click Start Data Logging. Figure 25: File Menu 4. To stop recording, on the File menu, click Stop Data Logging. A .txt file is saved in the selected directory. 4.4.7. Raw Detection The Raw Detections dialog box allows you to view detection values in many ways. It provides filters to isolate detection parameters. To open the Raw Detections dialog box, on the View menu, click Raw Detections.
Figure 26: Example of Raw Detection Dialog Box The following is a description of the parameters available in the Raw Detections dialog box. Min and Max Amplitude The value entered in the Min Amplitude box will filter detections with amplitude lower than that value. For example, if the minimum amplitude is set to 5, only the detections with amplitude of 5 and more will be displayed. The value entered in the Max Amplitude box will filter detections with an amplitude lower than that value.
Flag Column The Flag column displays a number that represents a detection type. See section 3.2 for a description of the measurements data including flags. 4.4.8. Update This option allows you to update the firmware in your sensor. It should be used only under the supervision of a LeddarTech support technician. 4.4.9. Preferences Preferences are used to change various settings related to the display of the Leddar™ Configurator software.
Under General Leddar™One Sensing Module, some parameters of main window can be modified. Select “Show all detections” in order to display multi-detection in the distance gauge. 4.4.10. License Manager Some features need an activation key. Contact LeddarTech for more information. 4.4.11. Device State Information about a device is accessible by clicking the Device State command on the View menu. Figure 28: View Menu The Device State window opens.
Figure 29: Device State Window Temperature This section indicates the temperature of the device. Timers & Load This feature gives the time in days, hours, minutes, and seconds since the last sensor was started. Acquisition State This section gives the current intensity of the LED. It is particularly useful when the device is set in automatic LED intensity, since the user can see the intensity selected by the sensor. Serial number The serial number of the device as assigned by LeddarTech.
4.4.12. Calibration of the Static Noise The static noise of the sensor can be calibrated by the user. This feature is available with the integrator license available on request by contacting LeddarTech customer service. See Section 4.4.10 to have more details about how to add a new license to LeddarTM Configurator. NOTE: When the calibration is completed, the user cannot roll back to the factory calibration.
Figure 31: Calibration Window A progress bar will show the progression of the calibration. It should take about 1 minute to execute the calibration. The calibration can be cancelled at any time by clicking on “Cancel”.
5. Specifications 5.1. General Table 13: General Specifications LED pulse rate 72.131 kHz Photodetector size 1 mm2 Measurement rate 2.2, 4.4, 8.8, 17.6, 35.2, 70.4 Hz. 3.3V UART link 2-wire, half-duplex, 9600 to 115200 BPS RS-485 2-wire, half-duplex, 9600 to 115200 BPS Operating temperature -35 °C to 45 °C 5.2. Mechanical Table 14: Mechanical Specifications Diameter 50.8 mm Depth 30.6 mm Weight 14 g 5.3.
5.4.
5.5. Performance Table 17: Sensor Performance Summary Performance Metrics Values Descriptions Measurement Accuracy* ±5 cm Distance measurement error. Measurement Accuracy with Saturated Signal ±10 cm - Measurement Precision 5 mm (1 𝜎) Standard deviation of the measured distance.
Accuracy Mesured Distance (m) 5.5.1. 40 30 20 10 0 0 5 10 15 20 25 30 35 40 Error (m) 0.08 Reflective Tape, 5x7 cm Kodak White Card 90%, 20x25 cm Kodak Grey Card 18%, 20x25 cm 0.06 0.04 0.02 0 0 5 10 15 20 25 Reference Distance (m) 30 35 40 Figure 32: Accuracy versus Target Reference Distance (accumulation 256 and oversampling 8) 5.5.1. Supply Voltage versus Accuracy Figure 33 shows the distance measurement offset as a function of the sensor supply voltage. 0.
5.5.1.
5.5.2. Detection Threshold The detection threshold tables are designed to provide robust detections and to minimize false detections caused by noise in the full-waveform signal. They are presented in Figure 35. Figure 35: Threshold Tables The multiple lines on each graph present the thresholds for numbers of accumulations of 1 (top curve), 2, 4, 8, 16, 32, 64, 128, 256, 512, 1024, 2048 and 4096 (bottom curve).
5.6.
5.7.
6. Help For technical inquiries, please contact LeddarTech technical support by registering online at www.leddartech.com/support to easily: Follow up on your requests Find quick answers to questions Get valuable updates Or by contacting us at: + 1 418 653 9000 + 1 855 865 9900 8:30 a.m. - 5:00 p.m. Eastern Standard Time To facilitate the support, please have in hand all relevant information such as part numbers, serial numbers, etc. E-mail support@leddartech.com Company address LeddarTech Inc.