Laureate™ XLog™ Datalogging Software Operator Manual PC-based data logging with Laurel meters and transmitters. Compatible with Ethernet, USB, RS485 and RS232 connections, Modbus RTU, Modbus ASCII, and Custom ASCII protocols. LAUREL Electronics Inc. 3183-G Airway Ave, Costa Mesa, CA, 92626, USA Tel: (714) 434-6131 Fax: (714) 434-3766 Website: www.laurels.
1. OVERVIEW When a PC running Laurel's XLog datalogging software is connected to Laureate meters and transmitters, readings can be written to disk in the form of text files or MS Excel files. User settable parameters include the logging time interval in seconds, header data with or without time and date, and password protection for the setup files. Readings can also be displayed on the PC monitor the form of up to 64 simulated panel meters in up to 4 groups (or windows) of up to 16 meters each.
Single Instrument Connected to a PC • For connection to a PC RS232 port, the instrument can be a Laureate meter with an RS232 interface board (ordering option 1) and Laureate RS232 interface cable CBL01. The instrument can also be a Laureate LT transmitter whose data output has been jumpered for RS232 and use RS232 interface cable CBL04. The PC must be set to the appropriate COM port and instrument address (the default address is 1).
• For connection to an Ethernet LAN, a PC and multiple Laureate instruments can be plugged into the same LAN using Ethernet cables. The instruments can be Laureate meters with an Ethernet interface board (ordering option 7) or LTE transmitters. Laureate Ethernet Nodes are then automatically discovered by XLog Datalogging Software along with any Devices attached to the Nodes by an RS485 bus.
• For connection of multiple meters to a single Ethernet line, a first Laureate meter can be equipped with an Ethernet-to-RS485 converter board (ordering option 8). This board has an RJ45 jack to connect to a LAN via an Ethernet cable plus an RJ11 jack to connect to an RS485 bus with up to 30 additional meters. These meters must be equipped with an RS485 interface board (ordering option 2). The connection between the meters is via Laurel’s CBL03 RS485 Data Cable for Meters.
2. COMPLEMENTARY SOFTWARE AND MANUALS Use XLog™ Datalogging Software requires prior setup of the meters and transmitters to be datalogged or displayed, and prior configuration of Ethernet Nodes if Ethernet is used. Please refer to the following documentation and software, which are downloadable from our website at no charge: 1. Instrument User Manuals.
3. XLOG SOFTWARE INSTALLATION Using a Windows computer, go to http://www.laurels.com/download-software.htm. Click on xlogx_x_x.exe and do a Save File to your local disk. Double click on the saved file and specify and unzip directory, such as C:\Program Files\XLog. This will unzip the installation files in that directory. Open that directory and double-click on setup.exe. Specify another directory, such as C:\XLog, and follow the prompts.
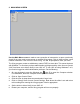
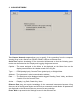
2. MAIN MENU SCREEN Use the Main Menu screen to make a new connection to instruments, to open a previously saved XLog setup, and to save a new or modified XLog setup. Click on New to make a new network connection. Click on Exit to close XLog. You will be prompted to save your work. The XLog program creates a subdirectory named FILES to store data.
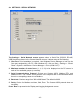
3. CHOOSE NETWORK The Choose Network screen allows you to specify if the connection from the computer running XLog is via a Serial Port (RS232, RS485, USB) or an Ethernet Port. Serial Port requires knowledge of the connected instruments so that the following parameters can be entered on the Display and Logging Assignment screen. Caption…..The name assigned to the Meter to be displayed on the Meter face on the display screen and on the Header record of the Log file. Type…..
4a. SETTINGS – SERIAL NETWORK The Settings – Serial Network screen appears when ‘a Serial Port (RS-232, RS-485, USB)’ has been chosen in the Choose Network screen. It allows setup of the following: 1. Com Port. Prior knowledge is required. Use Windows Device Manager to look up the Com port assigned by your PC. With Windows XP, click on Start > Settings > Control Panel > System > Hardware > Device Manager > Ports (COM & LPT). 2.
4b. SETTINGS – ETHERNET NETWORK The Settings – Ethernet Network screen appears when ‘an Ethernet Port’ has been chosen in the Choose Network screen. It allows setup of the following: 1. The Maximum number of meter faces (1, 4, 9, 16) to be displayed on the PC screen in each of four available groups (or screens). 2. The Network Type as either LAN (direct connection to a Local Area Network) or WAN (connection via the Internet).
5. ETHERNET DISCOVERY The Ethernet Discovery screen displays all discovered Ethernet Nodes and Devices associated with each Node, and allows setup parameters to be associated with each. Devices can be the single meter or transmitter which hosts the Ethernet Node, or multiple Devices attached to the Node via an RS485 bus. There can be from 1 to 31 Devices (meters and/or transmitters) per Node. Click on the cells of the last 5 columns to select the action to be taken for each Device.
Grid column headings: NODE#.............. The letter assigned by XLog to the Node and to all meters connected to that Node. NODE NAME…. The name assigned to the Node. The default name is “Node” followed by the Node’s unique MAC address. Node Manager Software can be used to assign a different name to facilitate recognition. METER NAME.. The name that will be displayed for the Device on the XLog data screens and in logging headers. Descriptive names can be assigned using Node Manager Software.
5. DISPLAY AND LOGGING ASSIGNMENT The Display and Logging Assignment screen is used to define the parameters to be displayed and/or logged. Each line represents either a Hardware meter (listed first) or a Virtual meter (listed next). A pop-up Data Entry form appears by clicking anywhere on the grid line, and is used to make or edit parameters for that meter. The columns on the Data Entry form match the grid column headings. Press “Next’ after you have made your entries. Column headings: ID.................
ADDR.......... Serial communications address. Programmed via a meter’s front panel or via Instrument Setup Software. Not required for a single instrument. DATA .......... The items to be displayed and logged. These are Reading, Peak, Valley, plus Item2 and Item3 for pulse input counters. ACTION ...... Selects how the Data is recorded. Selections are Display, Log, Both, Read Only, or None. Headings Applicable to Virtual meters: SETPT 1...... The value that determines the Alarm 1 status. SETPT 2......
6. LOG SETUP The Log Setup screen provides selection of the logging record parameters, the name of the Data File to be logged, and whether the Data File is to be a text file or an Excel file. ‘Log to’ allows you to select whether a new file is to be a text file readable by a text editor (extension .df1) or an Excel file readable by the MS Excel (extension .xls). The file will be located in the application directory /Files.
A Separator character may be chosen to separate the data values in the record. Any printable character may be entered into the box. For space, enter ‘sp’. For tab, enter ‘tab’. ‘Save’ and ‘Save As’ command buttons allow your to save the Setup File that contains all configuration parameters entered on all screens. You will be give the option to password protect the file. The Setup File is located in the application directory/Files and has the extension .sf1.
6. LOGGING PROGRAM The Program screen displays all of the Meter faces selected for display in 4 groups of either 16, 9, 4 or 1 as selected on the Settings screen. Before logging to file, make one of three selections presented in the upper right of the screen: 1) Overwrite any existing data (erases file before writing), 2) Append data with Header, or 3) Append data without Header. Click on ‘Start Logging’ to start logging to file. Click on ‘Stop Logging’ to stop logging to file.
The number and time of the last record are displayed in red cells at the top of the screen. If the data is being logged to a text file, the logged data can only be observed from the Meter faces. If the data is being logged to an Excel file, the Excel screen may be visible in the background and can be brought to the foreground by clicking the Excel symbol on the Task bar. Clicking the symbol again returns the Program screen to the foreground, which is necessary to Stop Logging.