
User's Manual

LAUNCH X-431 PAD III User Manual
49
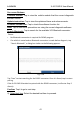
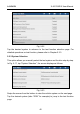
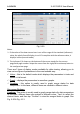
Fig. 5-29
Notes:
1.
Ifthevalueofthedatastreamitemisoutoftherangeofthestandard(reference)
value,thewholelinewilldisplayinred.Ifitcomplieswiththereferencevalue,it
displaysinblue(normalmode).
2.
Theindicator1/Xshownonthebottomofthe
screenstandsforthecurrent
page/totalpagenumber.Swipethescreenfromtheright/lefttoadvance/returnto
thenext/previouspage.
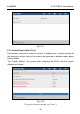
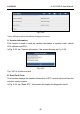
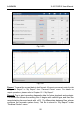
There are 3 types of display modes available for data viewing, allowing you to
view various types of parameters in the most suitable way.
9
Value – this is the default mode which displays the parameters in texts and
shows in list format.
9
Graph – displays the parameters in waveform graphs.
9
Combine – this option is mostly used in graph merge status for data
comparison.
In this case, different items are marked in different colors.
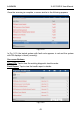
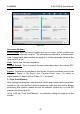
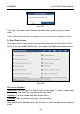
On-screen Buttons:
Combine:
This option is mostly used in graph merge status for data comparison.
In this case, different items are marked in different colors. Tap it to select the
desired items, and then tap “Confirm” to view the merged items in graph. See
Fig. 5-30 & Fig. 5-31.