
User's Manual
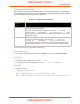
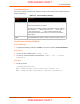
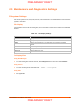
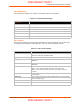
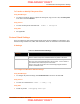
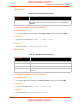
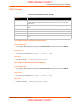
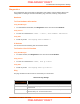
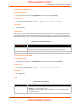
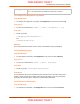
Table Of Contents
- PremierWave XC HSPA+ User Guide
- 1: Using This Guide
- 2: Introduction
- 3: Installation of PremierWave XC HSPA+
- 4: Using DeviceInstaller
- 5: Configuration Using Web Manager
- 6: Network Settings
- Network 1 (eth0) Interface Settings
- Network 1 (Link) Settings
- Network 1 (Failover)
- Network 2 (Cellular) Settings
- Network 2 (Link) Settings
- Gateway
- 7: Cellular
- 8: Action Settings
- 9: Line and Tunnel Settings
- Line Settings
- Tunnel Settings
- Serial Settings
- To Configure Tunnel Serial Settings
- Packing Mode
- To Configure Tunnel Packing Mode Settings
- Accept Mode
- To Configure Tunnel Accept Mode Settings
- Connect Mode
- To Configure Tunnel Connect Mode Settings
- Disconnect Mode
- To Configure Tunnel Disconnect Mode Settings
- Modem Emulation
- To Configure Tunnel Modem Emulation Settings
- Relay Output
- 10: Terminal and Host Settings
- 11: Services Settings
- 12: Security Settings
- 13: Maintenance and Diagnostics Settings
- Filesystem Settings
- Protocol Stack Settings
- SMTP Settings
- Diagnostics
- Threads
- Clock
- System Settings
- Discovery and Query Port
- 14: Advanced Settings
- 15: Security in Detail
- 16: Updating Firmware
- 17: Branding the PremierWave XC HSPA+
- Appendix A: Technical Specifications
- Appendix B: Compliance
- Appendix C: Technical Support
- Appendix D: Binary to Hexadecimal Conversions
- Appendix E: USB-CDC-ACM Device Driver File for Windows Hosts

13: Maintenance and Diagnostics Settings
PremierWave XC HSPA+ User Guide 80
To Configure the Diagnostic Log Output
Using Web Manager
To configure the Diagnostic Log output, click Diagnostics in the menu and select Log.
Using the CLI
To enter the command level: enable -> config -> diagnostics -> log
Using XML
Include in your file:
<configgroup name=”diagnostics”>
and
<configitem name=”log”>
Memory
The memory information shows the total, used, and available memory (in kilobytes).
To View Memory Usage
Using Web Manager
To view memory information, click Diagnostics in the menu and select Memory.
Using the CLI
To enter the command level: enable -> device, show memory
Using XML
Include in your file: <statusgroup name=”memory”>
Processes
The PremierWave Processes information shows all the processes currently running on the
system. It shows the Process ID (PID), Parent Process ID (PPID), user, CPU percentage,
percentage of total CPU cycles, and process command line information.
To View Process Information
Using Web Manager
To view process information, click Diagnostics in the menu and select Processes.
Max Length Set the maximum length of the log.txt file.
Note: This setting becomes available when Filesystem is selected.
PRELIMINARY DRAFT
PRELIMINARY DRAFT