
Network Device User Guide EDS4100, EDS8PR, EDS16PR, EDS32PR
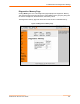
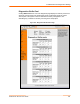
Table Of Contents
- Contents
- Preface
- Introduction
- Installation: EDS4100
- Installation: EDS8PR, EDS16PR and EDS32PR
- Getting Started
- Configuration Using the Web Manager
- Network, Serial Line, and Tunnel Settings
- Services Settings
- Security Settings
- Maintenance and Diagnostics Settings
- Advanced Settings
- Updating Firmware
- Factory Default Configuration
- Technical Specifications
- Networking and Security
- Technical Support
- Lantronix Cables and Adapters
- Compliance
- Warranty
- Index
10: Maintenance and Diagnostics Settings
EDS Device Servers User Guide 106
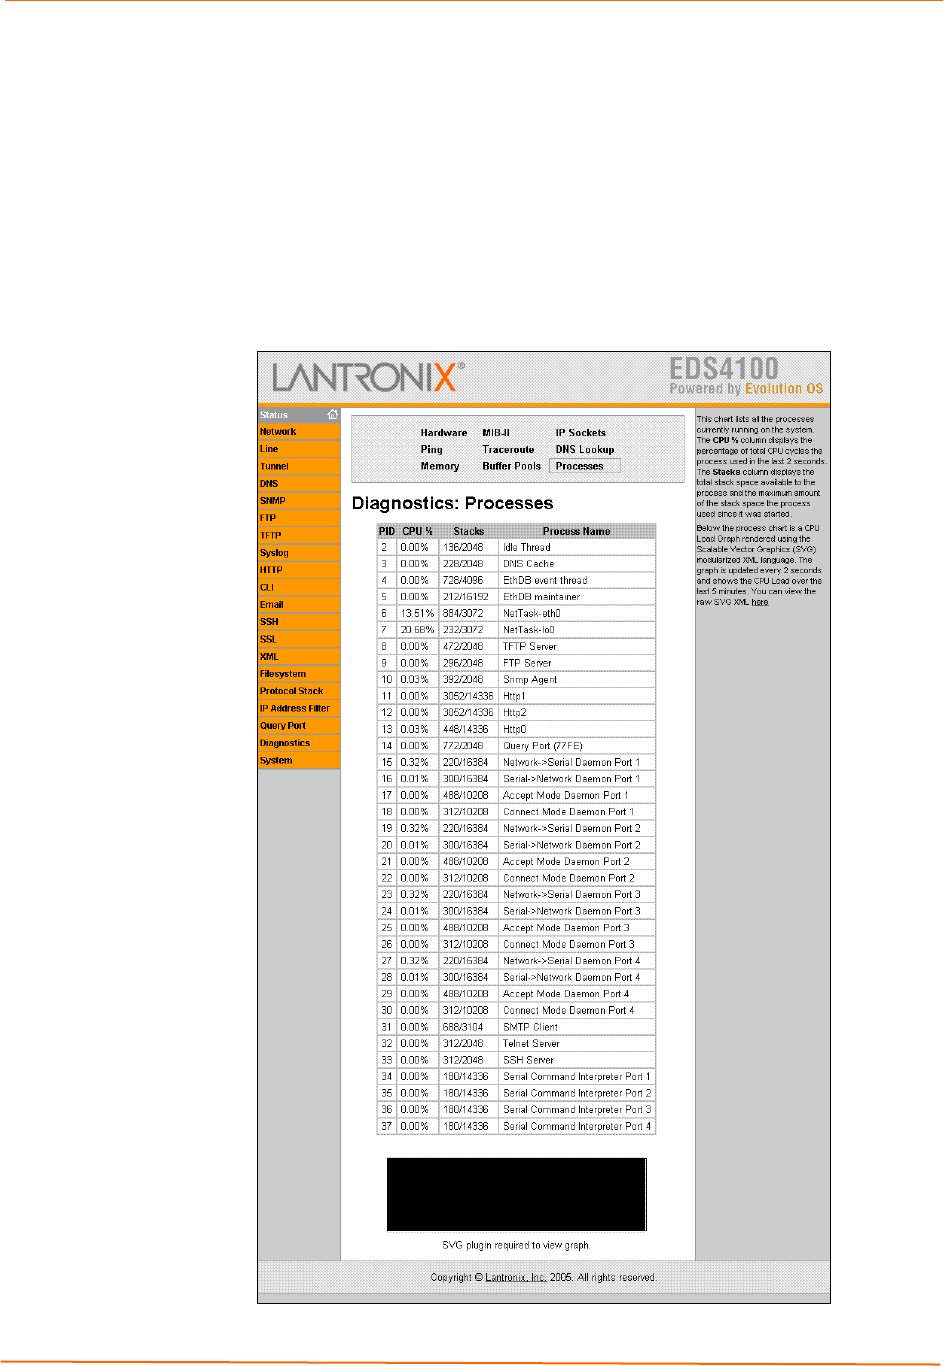
Diagnostics: Processes Page
Clicking Processes from one of the diagnostics page displays a read-only screen that
lists all processes running on the EDS.
The CPU % column displays the percentage of total CPU cycles a process used
in the last two seconds.
The Stacks column displays the total stack space available to the process and
the maximum amount of the stack space the process used since it was started.
Figure 10-10. Diagnostics: Processes Page