
Lake Controller Operation Manual Version 1.7.0

220
Lake Controller Operation Manual Rev 1.7.0
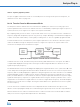
Analyzer Plug-in
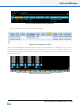
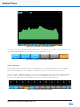
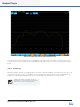
Figure 18-5: Spectrum measurement mode
The y‐axis scale of the SPECTRUM RTA is displayed on the right side of the Lake Controller interface. The
SPECTRUM PROPERTIES button provides access to additional functions.
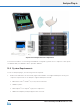
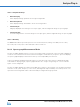
Figure 18-6: Spectrum Properties submenu
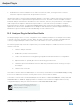
18 .4. 2.1 Averages
Averaging methods and calculations may vary depending on the analyzer being used and the available
options will be displayed in the scrollbar accordingly. Please refer to your analyzer documentation
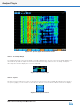
Upon entering the AVERAGES submenu, the Lake Controller displays a scrollbar with available averaging
schemes. Tap the desired averaging period then tap the AVERAGES SELECT button. The status text
between the scrollbar and the button-bar shows the active measurement parameters.
Figure 18-7: Averages submenu scrollbar