
Lake Controller Operation Manual
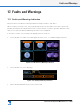
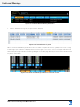
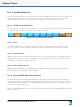
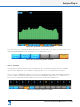
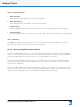
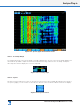
Table Of Contents
- 1. Welcome
- 2. Software Installation
- 3. Network & Firewall Overview
- 4. Lake Controller Tutorial
- 5. Home Menu Reference
- 6. EQ/Levels Menu Reference
- 7. System Store Recall Menu Reference
- 8. Modules Menu Reference
- 10. Groups Menu Reference
- 11. Solo/Mute Menu Reference
- 12. Icon Control Menu Reference
- 13. User Preferences Menu Reference
- 14. Pages Menu Reference
- 15. Network Menu Reference
- 16. Communication and Synchronization
- 17. Faults and Warnings
- 18. Analyzer Plug-in
- 19. Designer Mode Menu Reference
- 20. Lake-enabled Amplifier Reference
- 21. LM Series Reference and Operation
- 22. MY8-LAKE Reference and Operation
- 23. Keyboard Shortcuts
- 24. External Control Interfaces
- 25. Command Line Options
- 26. Firmware Update
- 27. Preset Manager
- 28. IP Address Reference
- 29. Corporate Information

214
Lake Controller Operation Manual Rev 1.5.9
Analyzer Plug-in
18.4.2.2 Amplitude Range
▸ Move Primary Up:
Move displayed range upward to show higher magnitudes
▸ Move Primary Down:
Move displayed range downward to show lower magnitudes
▸ Zoom Primary In:
Magnify displayed vertical range for most plot types; narrows magnitude range for Spectrograph
▸ Zoom Primary Out:
Decrease magnication of vertical range for most plot types; widens magnitude range for Spectrograph
18.4.2.3 Banding
The BANDING submenu provides options for the horizontal (x‐axis) scaling of the RTA; whole-octave,
1/3-octave, 1/6-octave, 1/12-octave and 1/24‐octave resolutions.
18.4.3 Spectrograph Measurement Mode
The Spectrograph displays frequency content of an input signal over a period of time. Instead of displaying
results for one measurement at a time (whether averaged or instantaneous), as per the Spectrum display,
the Spectrograph displays a measurement history over an adjustable period of time.
A Spectrum analyzer displays magnitude values for each fractional octave frequency band indicated by
vertical bars of varying height; a Spectrograph indicates the “height” using a range of colors to indicate
higher or lower magnitude.
The Spectrograph displays three‐dimensional data (time, frequency, and energy) on a two‐dimensional plot
with time on the y‐axis, frequency on the x‐axis, and magnitude represented by color. Exactly which color
represents which magnitude value is determined by the magnitude range specied.