
Owner's manual


68 Handbook BM 100 A
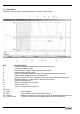
F7 – Signal Menu
Displays a real-time graph of signal amplitude over distance from flange.
Item
Item Description
1 Interface Threshold: voltage value to the left of the window
2 Level pulse indicator arrow
3 Level threshold: voltage value to the left of the window
4 Interface pulse indicator arrow
5 Gain and amplitude of selected pulse (with distance indicated by an arrow)
6 Hatched area: gauge dead zone representation
7 Flange reflection: this is not a measured form and will be displayed continuously.
8 Emitted signal level: voltage value to the left of the window
9 Selected interface pulse
10 Distance of level pulse from flange
11 Selected level pulse
12 Factory configured probe length, L2
Functions:-
F1 – Help On-line help file
F3 – Exit Exit to real-time measurement main window
F4 – Legend Displays information for identifying the gain, level threshold and dead zone.
F10 – Screen copy To select a directory and save the current screen as a bitmap file.