
User's Manual
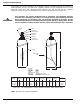
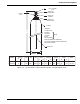
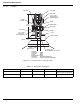
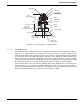

Component Descriptions
September 2013 2-6 P/N 81-CO2MAN-001
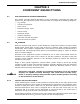
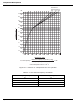
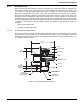
Figure 2-5. Pressure vs. Temperature for CO
2
Cylinders
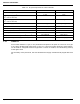
Table 2-2. CO
2
and H
2
0 Capacity Correlation
Rated CO
2
Capacity of Cylinder (lb) H
2
0 Capacity (%)
25 67
35 64
50 60
75, 100 68
180
170
160
150
140
130
120
110
100
90
88
80
70
60
50
40
30
20
10
0
-10
-20
-30
-40
0
200
400
600
800
1000
1200
1400
1600
1800
2000
2200
2400
2600
68%
PERCENT OF
WATER CAPACITY
PRESSURE, PSIA
TEMPERATURE, F
2800
3000
3200
3400
3600
3800
64%60%
Rated CO capacity of cylinders (in lbs)
2
capacity of cylinders (in lbs) at 60 F
0
HO
2
% of H O capacity =
2
x 100
Critical temperature of CO = 88 F
2
0